Bitcoin Technical Analysis:
Potential Bullish Continuation Ahead
Instrument: BTCUSDT
Time Frame: 30M
Exchange: BINANCE
Trading Type: Day Trading

Bitcoin's recent price action shows promising signs of a bullish continuation as key technical patterns emerge.
Traders should closely monitor critical levels and potential breakout points for a clearer market direction.

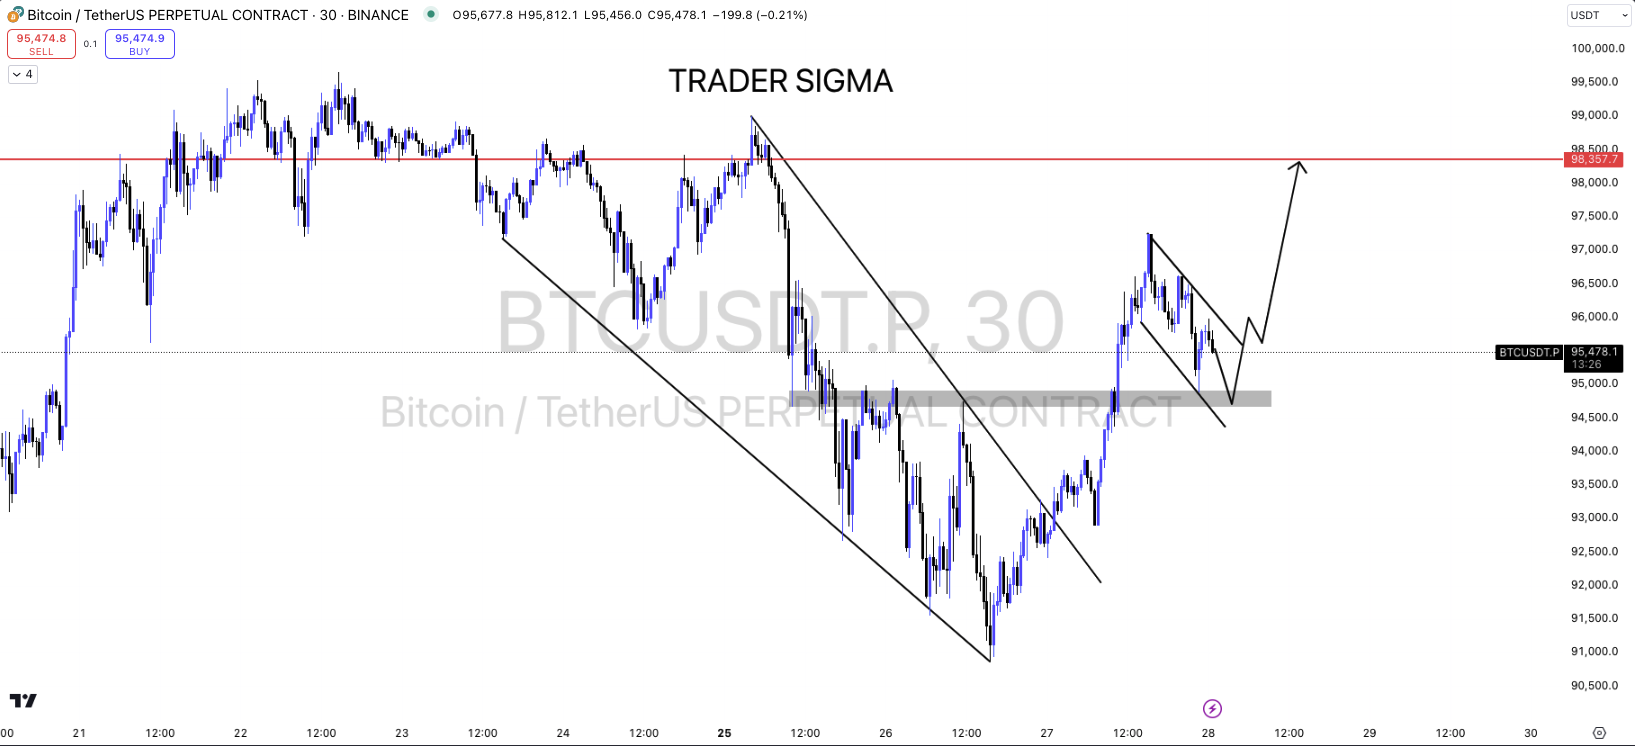
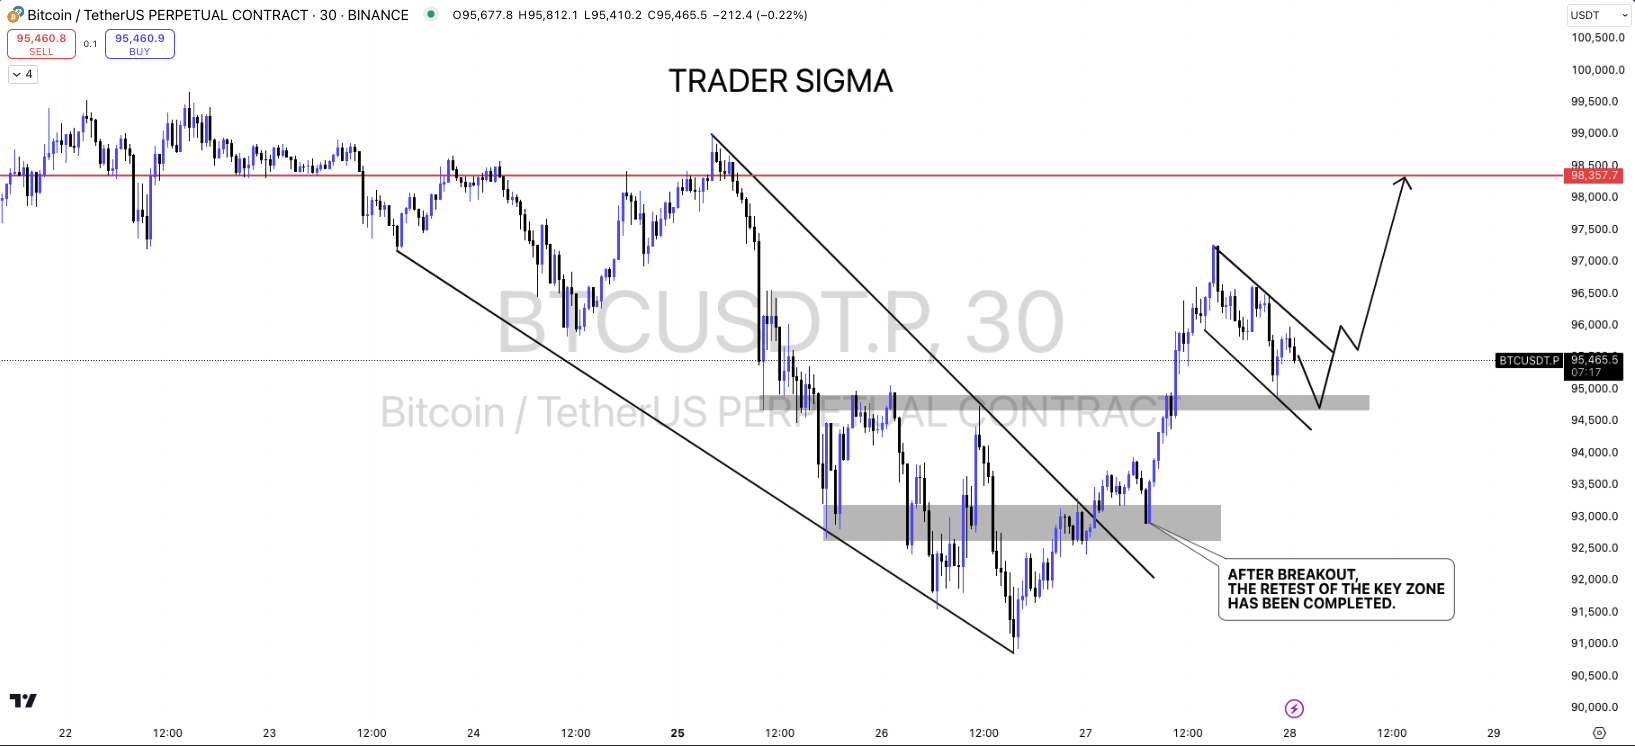
Breakout from Descending Channel
The chart reveals Bitcoin trading within a descending channel (falling wedge pattern), a formation often
associated with bullish reversals. True to the pattern, Bitcoin broke out of this channel, signaling the possibility of
an upward trend.

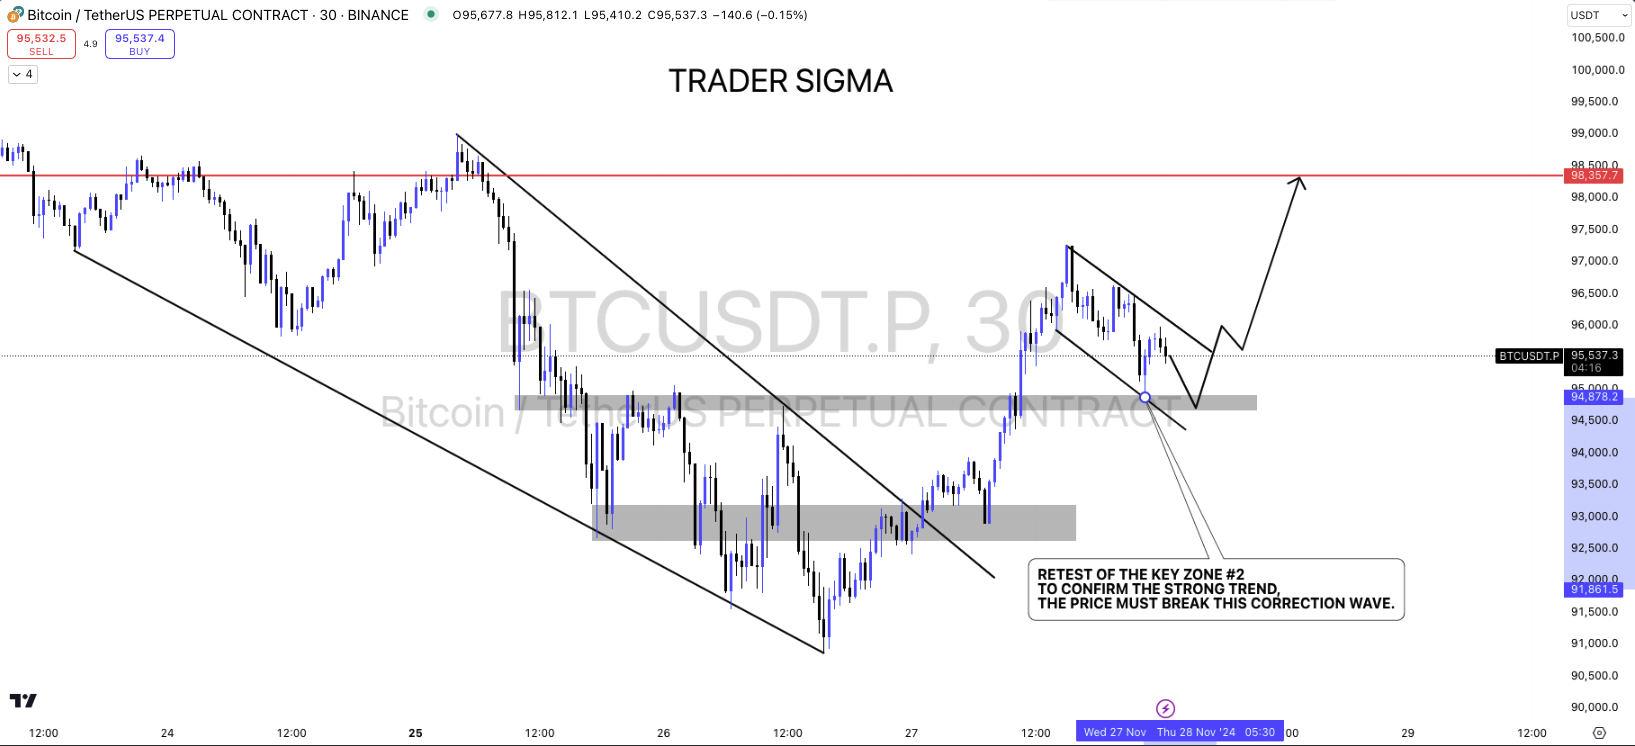
Retest and Consolidation
After the breakout, Bitcoin is consolidating near the $95,000 zone, which is marked as a significant support level.
This area is crucial, as a successful retest could confirm the breakout's strength. Traders will look for a bounce
from this zone as a signal for further upward movement.
Resistance at $98,357
The next critical hurdle for Bitcoin lies at the $98,357 resistance level. This red-marked zone is a key level that
could dictate the pace of the next move. A breakout above this resistance, supported by volume, might push
Bitcoin into a more sustained bullish rally.
Support Zone and Price Projection
On the downside, immediate support is seen at $95,000. Holding above this level is vital for maintaining the
bullish structure. Should Bitcoin sustain the breakout and consolidate successfully, the price is projected to move
higher, potentially testing and surpassing the $98,357 resistance.
Conclusion
Bitcoin's current technical setup suggests a bullish outlook. However, traders should remain cautious and await
confirmation of a successful retest of the breakout zone or a decisive move above resistance. If these conditions
are met, Bitcoin could be poised for significant upward momentum.
Stay tuned for further updates as Bitcoin's price action develops.

