Instrument: BTCUSDT
Time Frame: 1H
Exchange: Bitget
Trading Type: SwingTrading

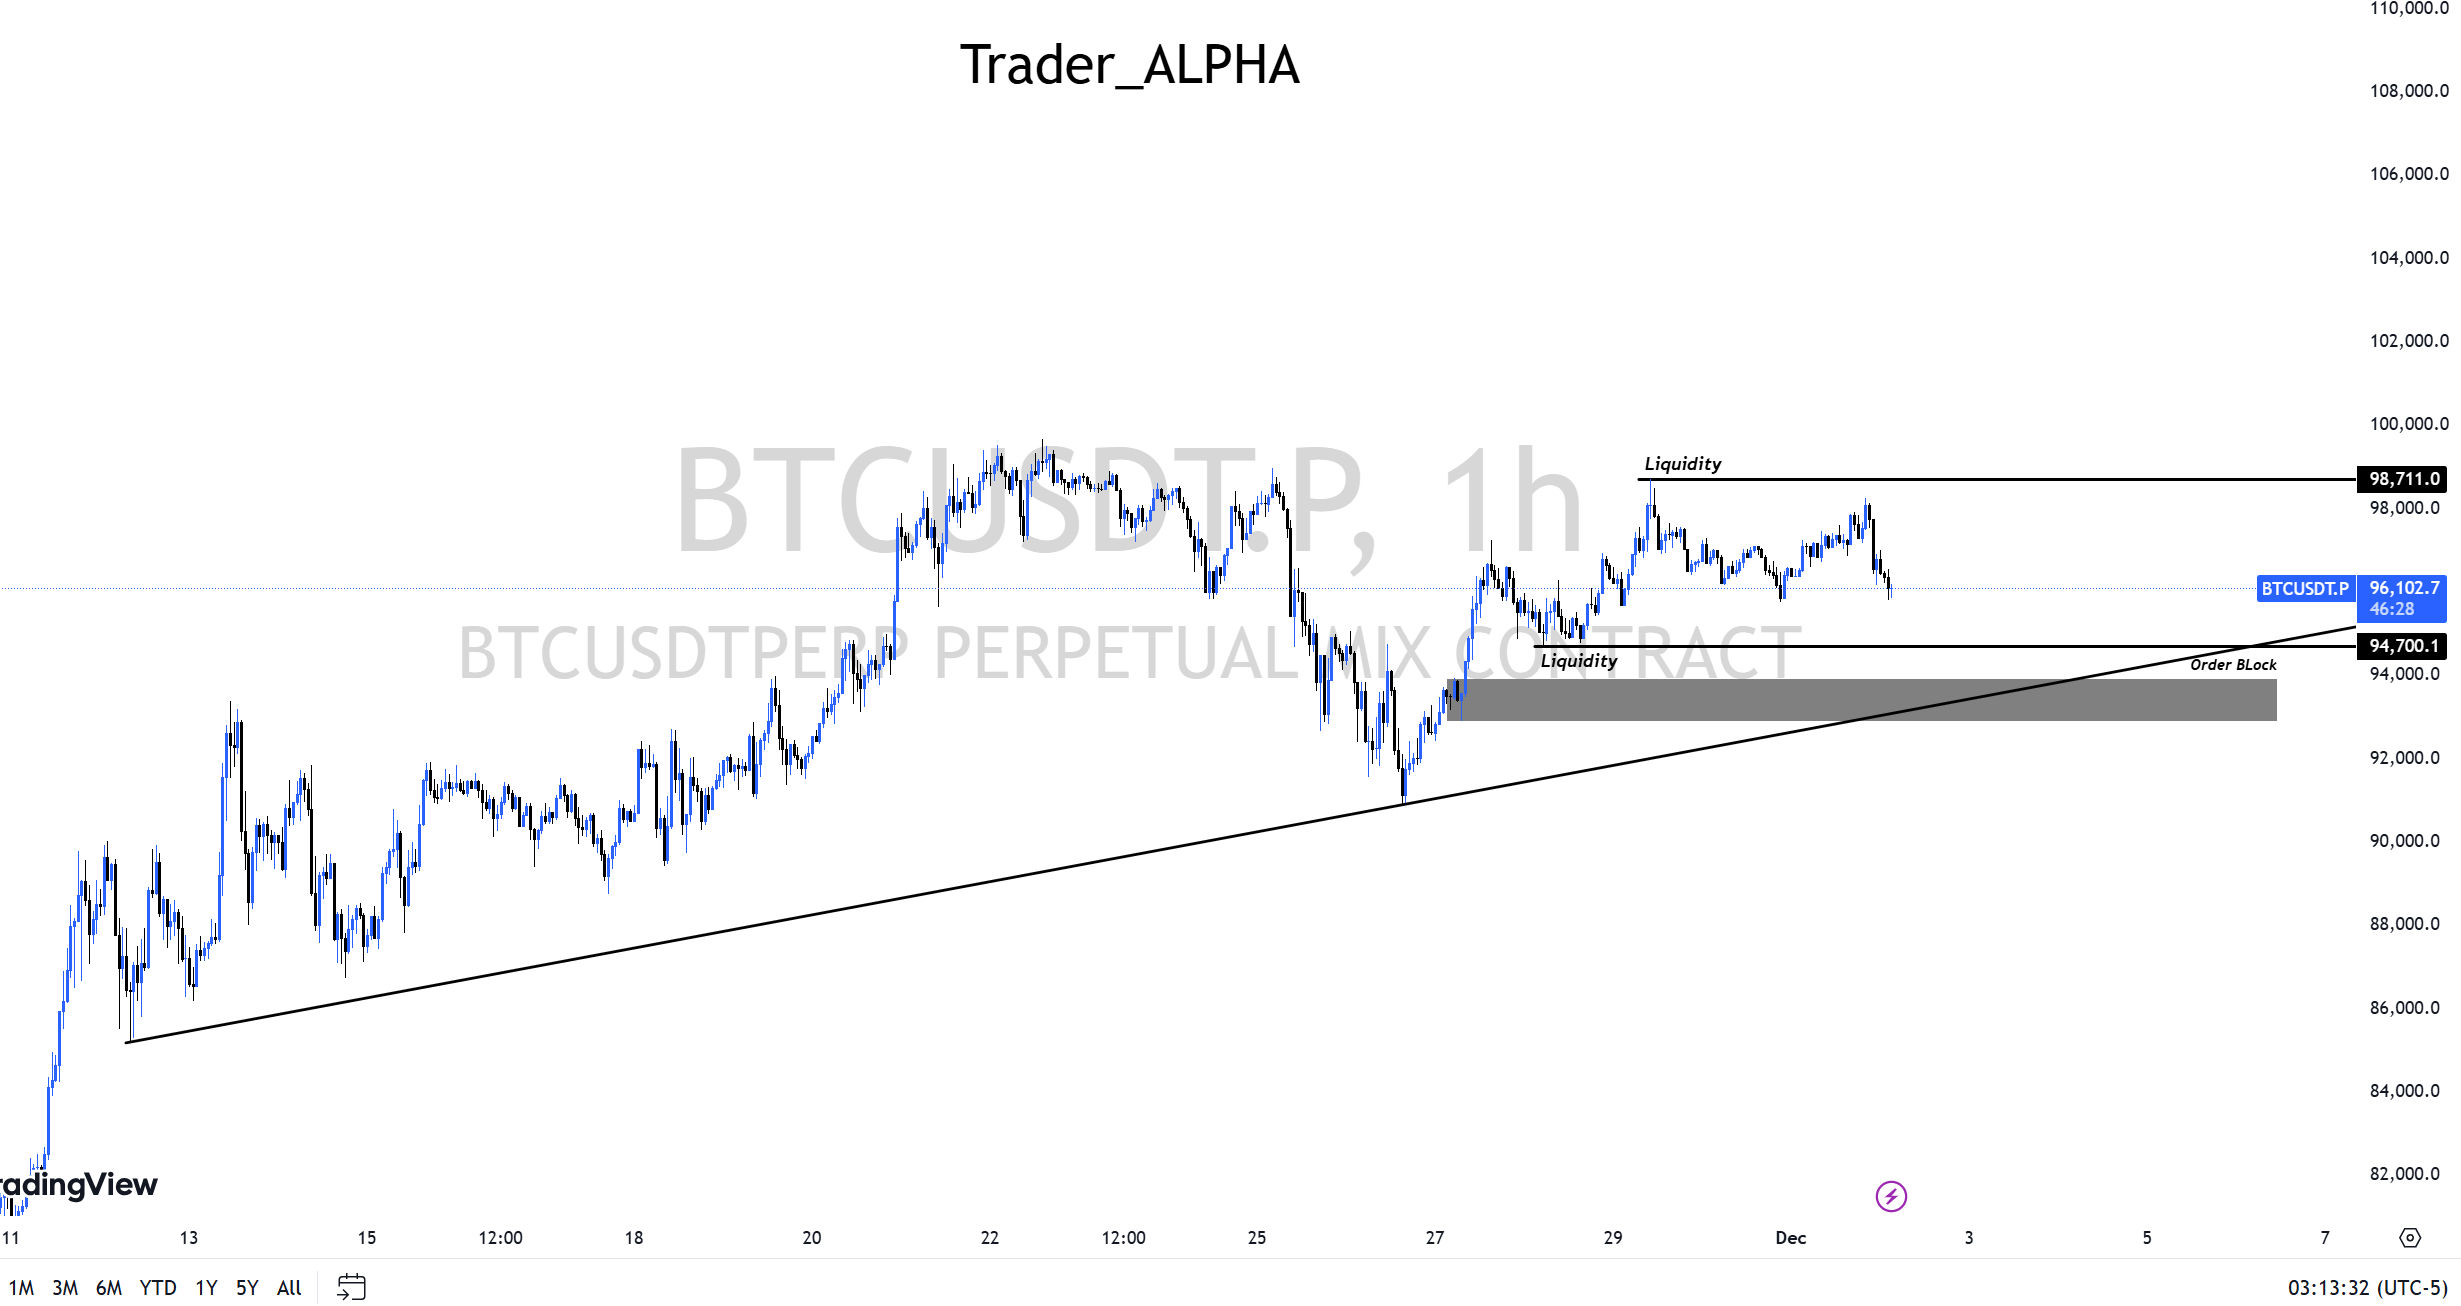
This is the Bitcoin 1-hour chart.
We can observe a slight decline toward the current trendline, which originates from the low established when Bitcoin first reached 90k. Additionally, I’ve marked the range high and low that persisted from late last week into the weekend as liquidity zones for more meaningful areas of focus. Furthermore, there is a significant order block remaining below, aligning with the point where the trendline is tested, making it a key level to watch.

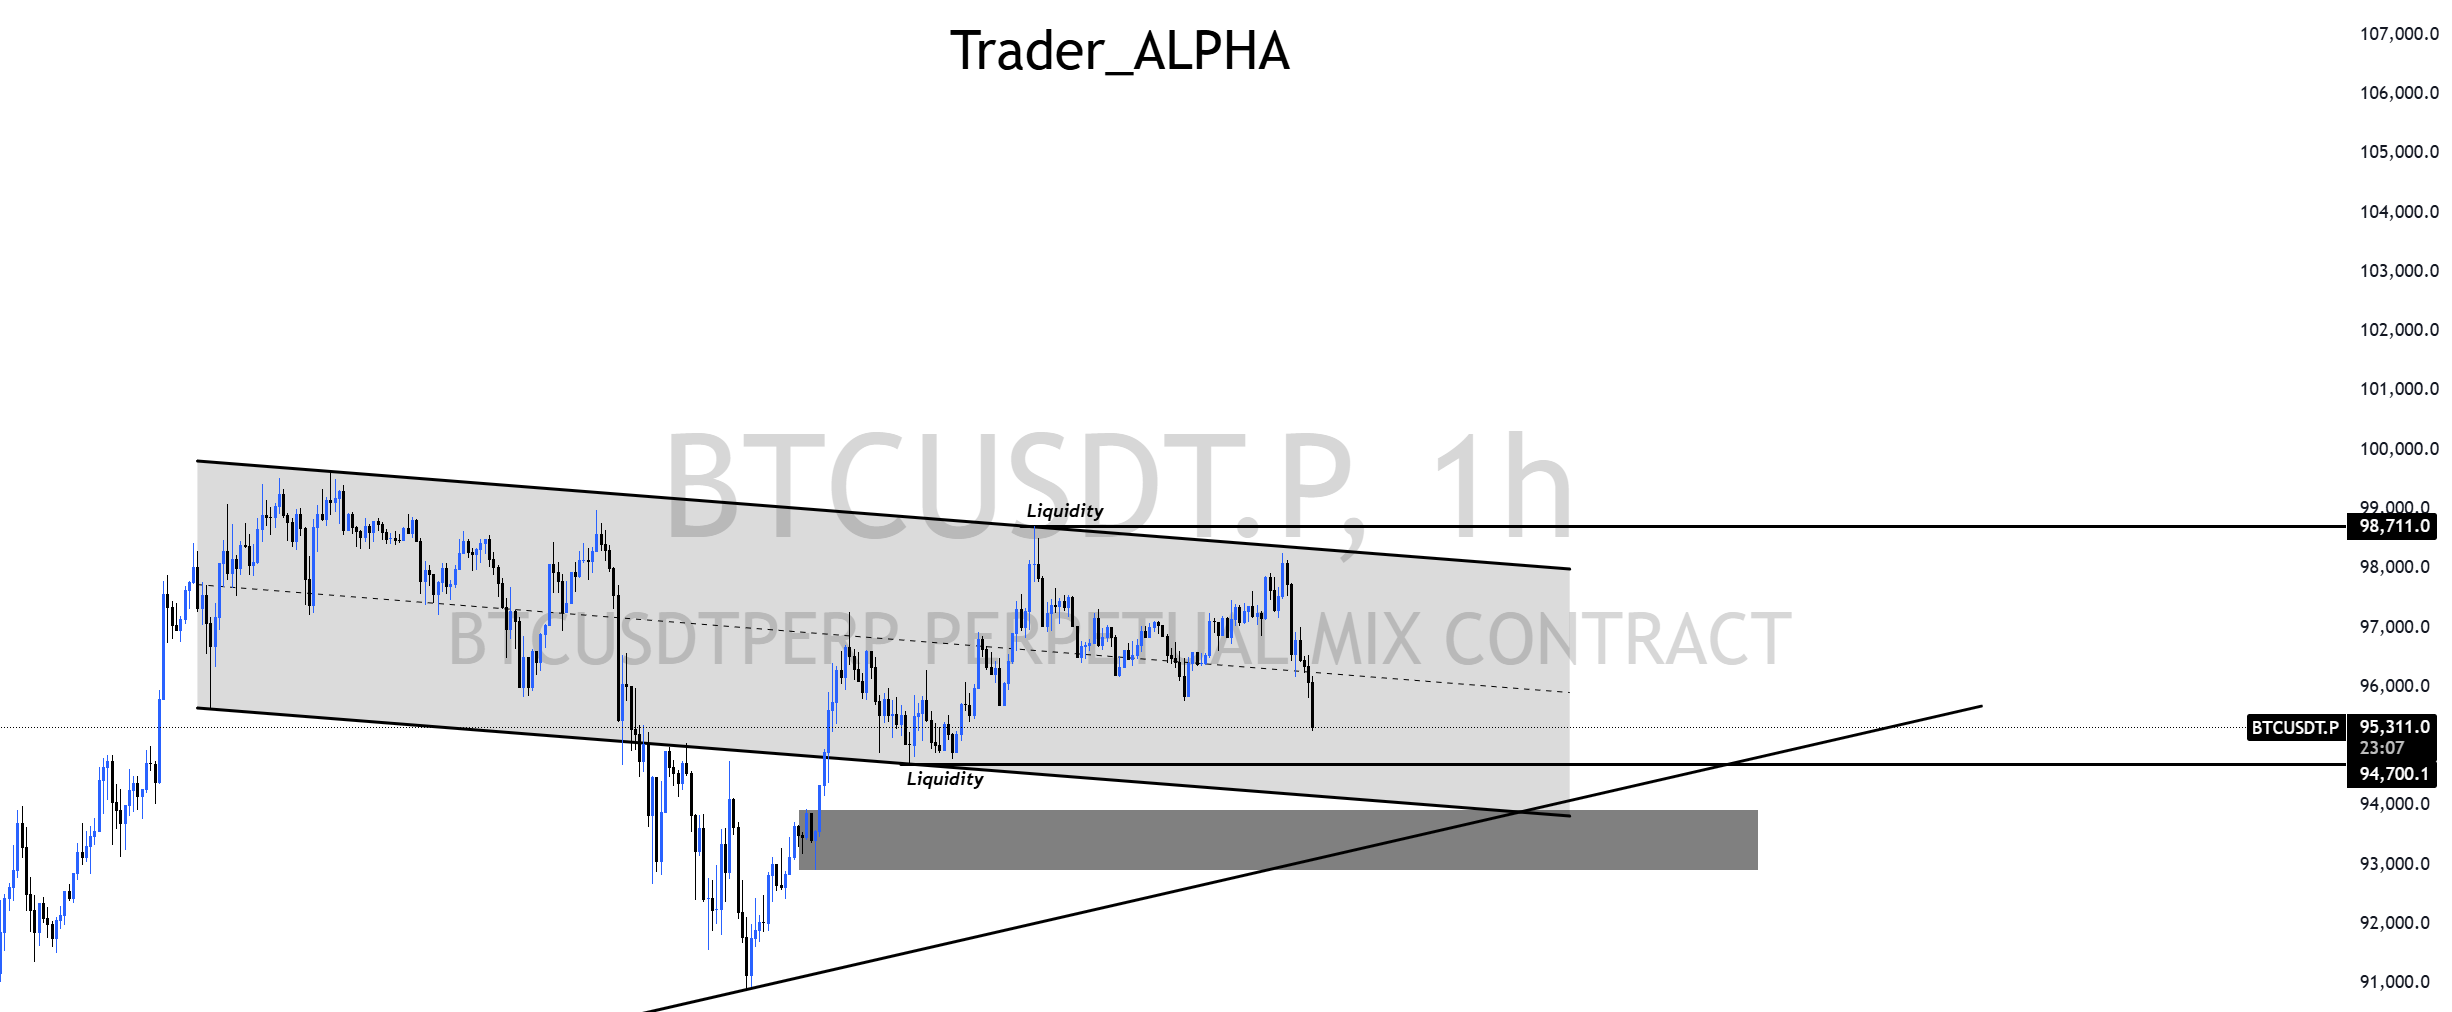
Next, upon identifying a meaningful channel, I discovered a sharply declining and then recovered horizontal channel, as shown above. If a reaction occurs at the intersection of the channel's lower boundary, the trendline, and the order block, I plan to maintain a strategy of monitoring detailed movements on a lower time frame before entering, rather than rushing into a position immediately.

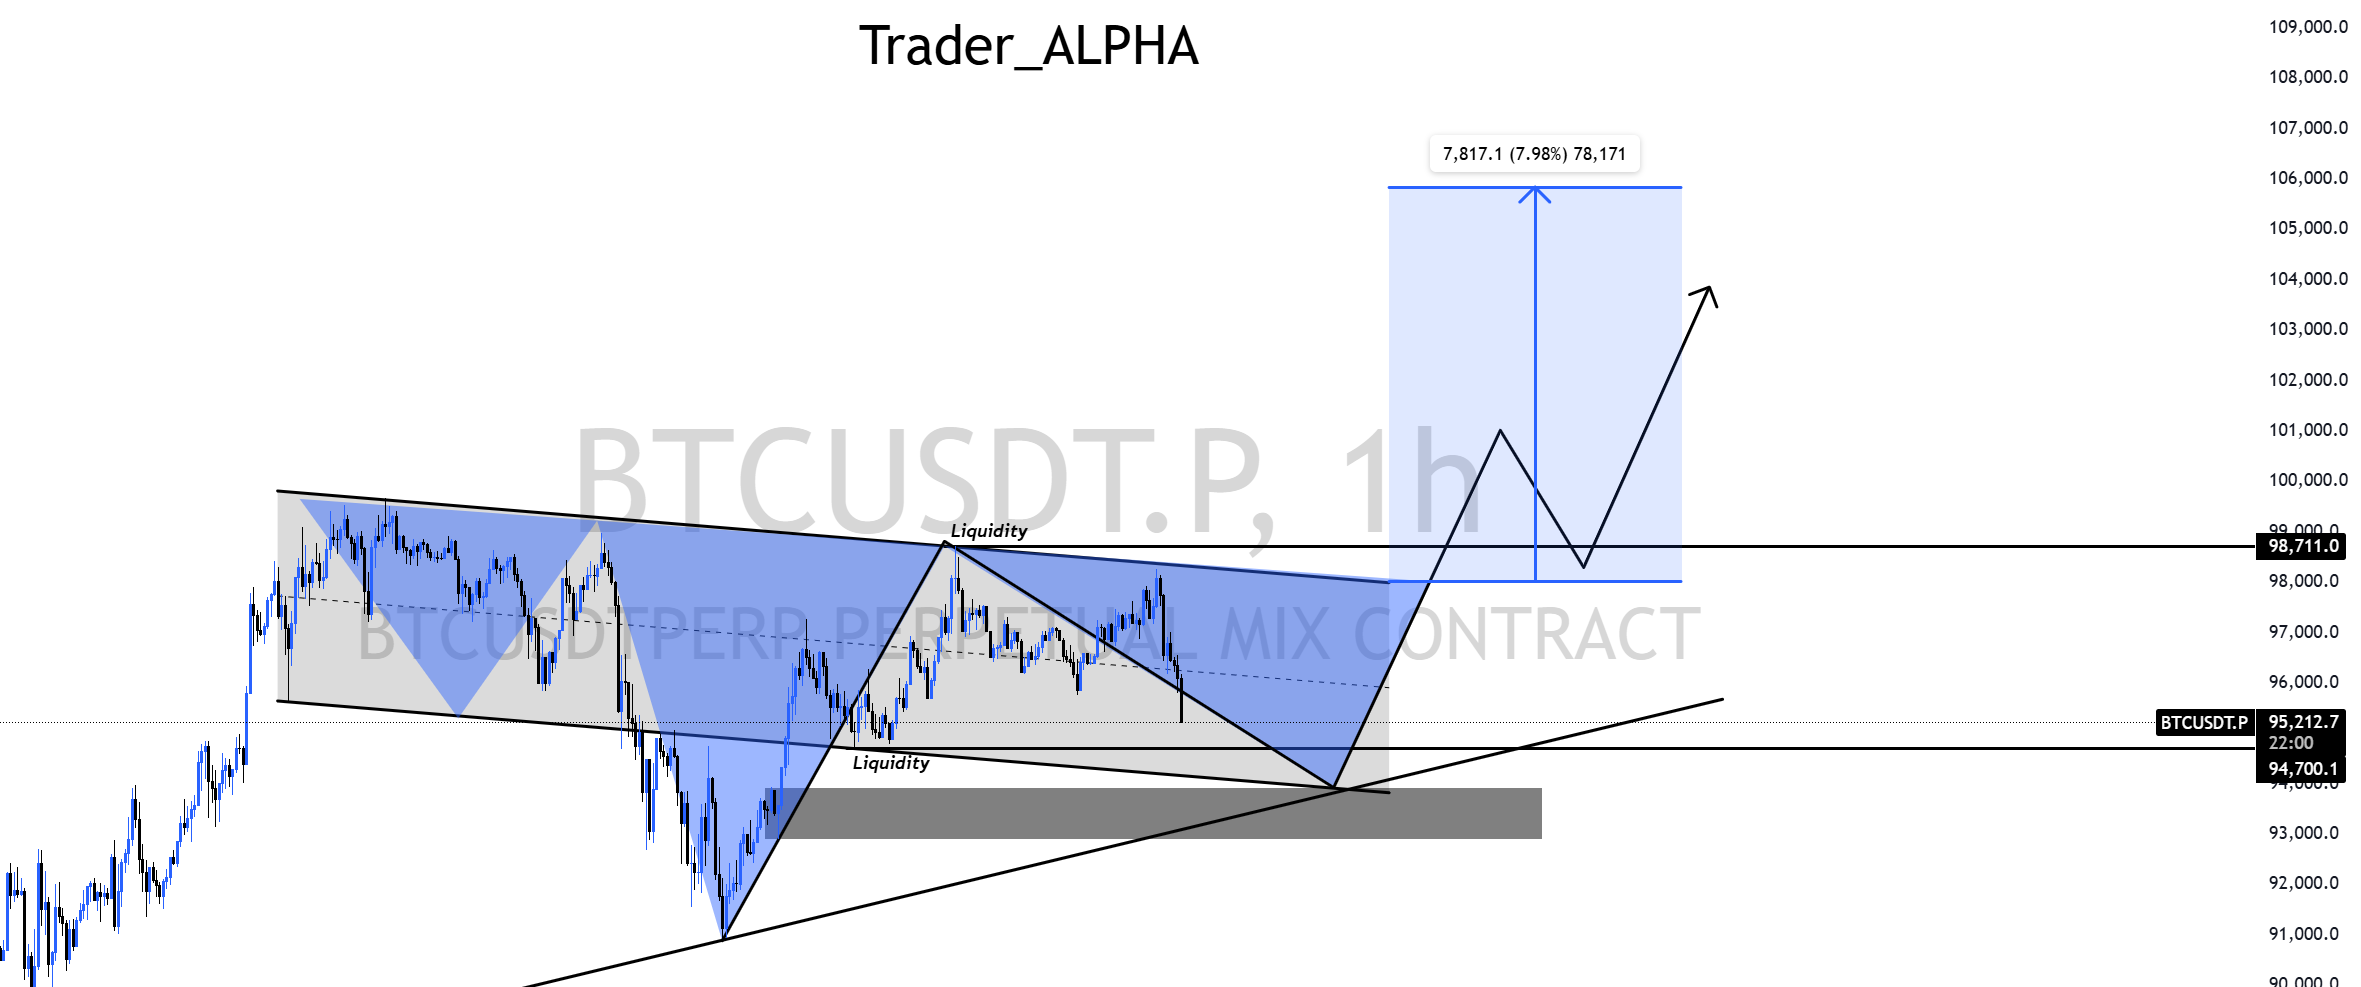
Finally, by consolidating the key confluence areas into one focal point, we can identify an inverse head-and-shoulders pattern that sets a target of 105k. This strategy is best approached by carefully observing the necessary details on a lower time frame before entering, ensuring a more calculated and precise entry.

