US100 Technical Analysis:
Anticipating a Bullish Continuation with Strategic Pullback Entry Setup
Technical Analysis: US100 (Nasdaq 100)
Daily Timeframe Analysis:

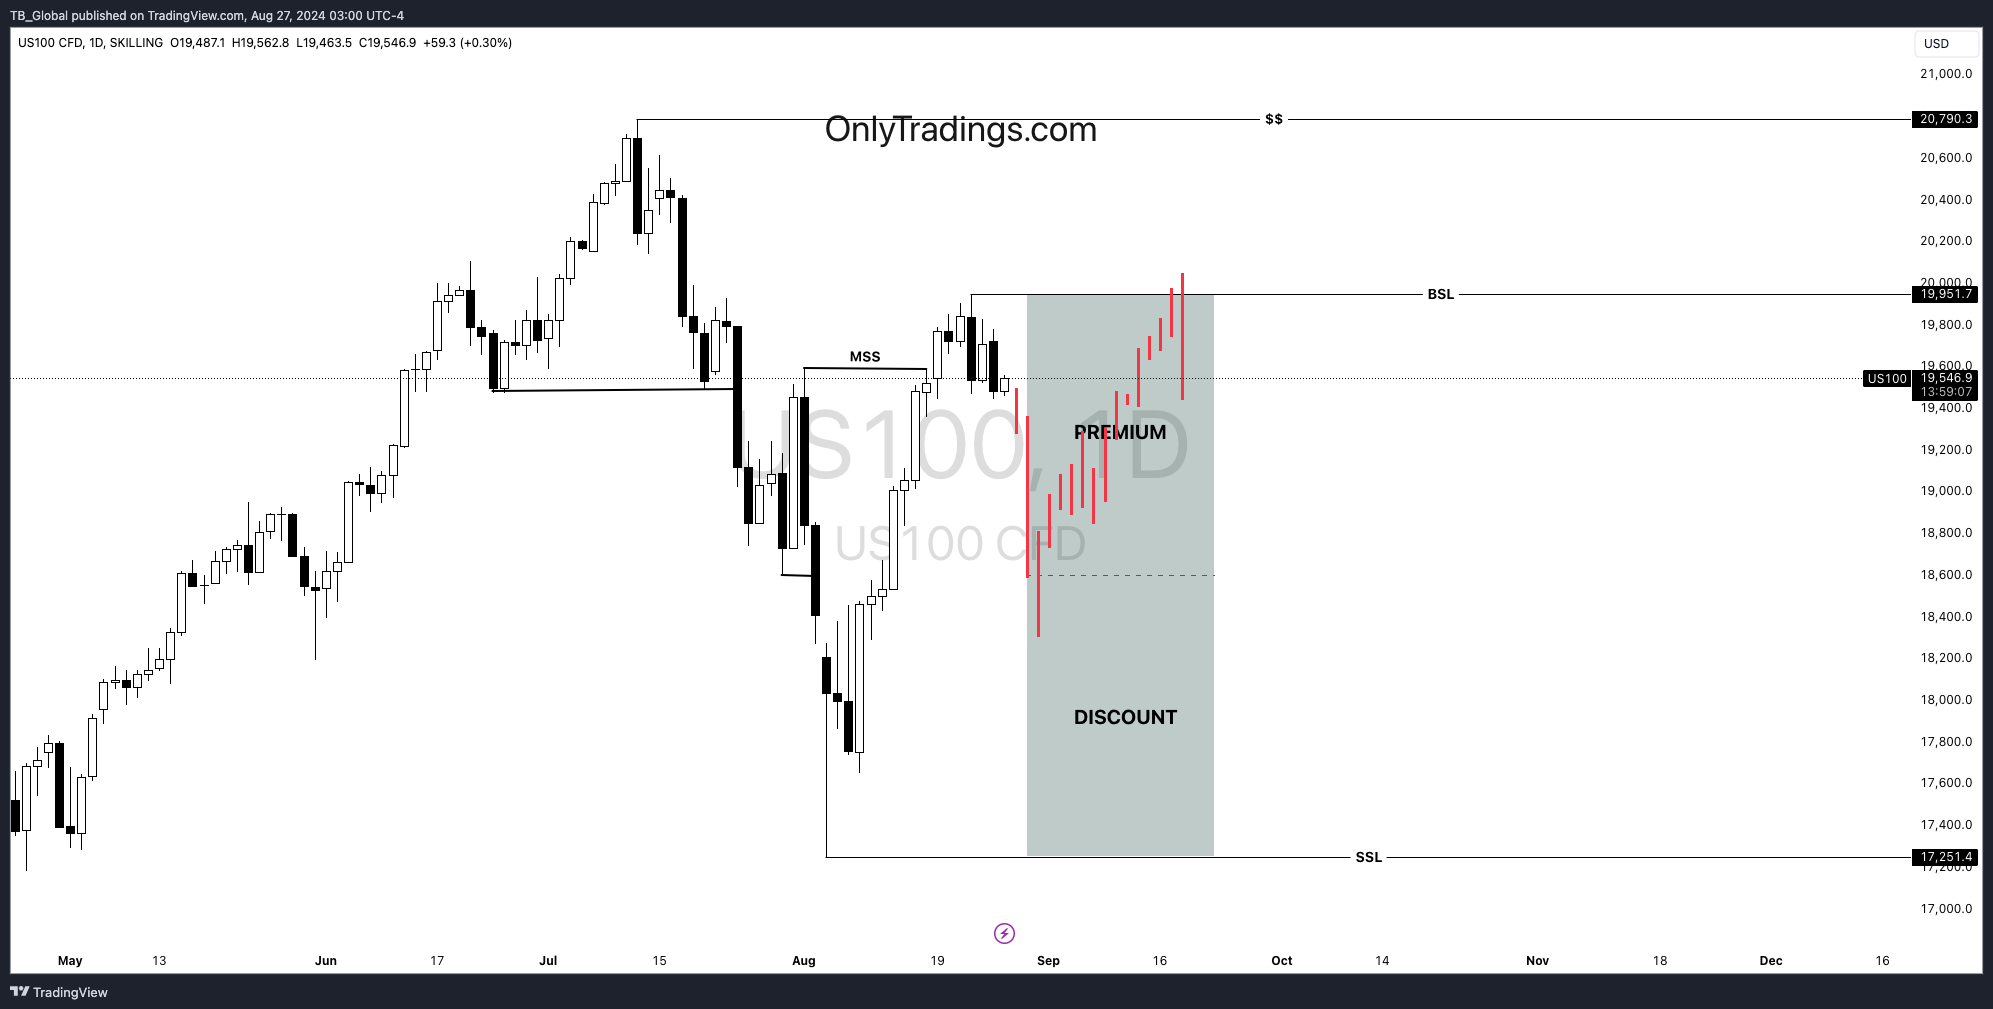
The daily chart of the US100 continues to showcase a bullish market structure, with a clear market structure shift (MSS) that signals further upside potential. The price has recently broken above significant resistance levels, affirming the ongoing uptrend. However, the current price level, located near a key resistance zone, suggests a potential for a short-term pullback.
The recent daily candle has closed after sweeping the lows from two days prior, typically indicating a liquidity grab. This price action implies that today's candle has a strong likelihood of testing the previous day's low, possibly setting up a retracement into the highlighted discount zone. This zone represents an area where buyers are likely to re-enter, providing a favorable opportunity for long positions as the uptrend resumes.
1-Hour Timeframe Analysis:

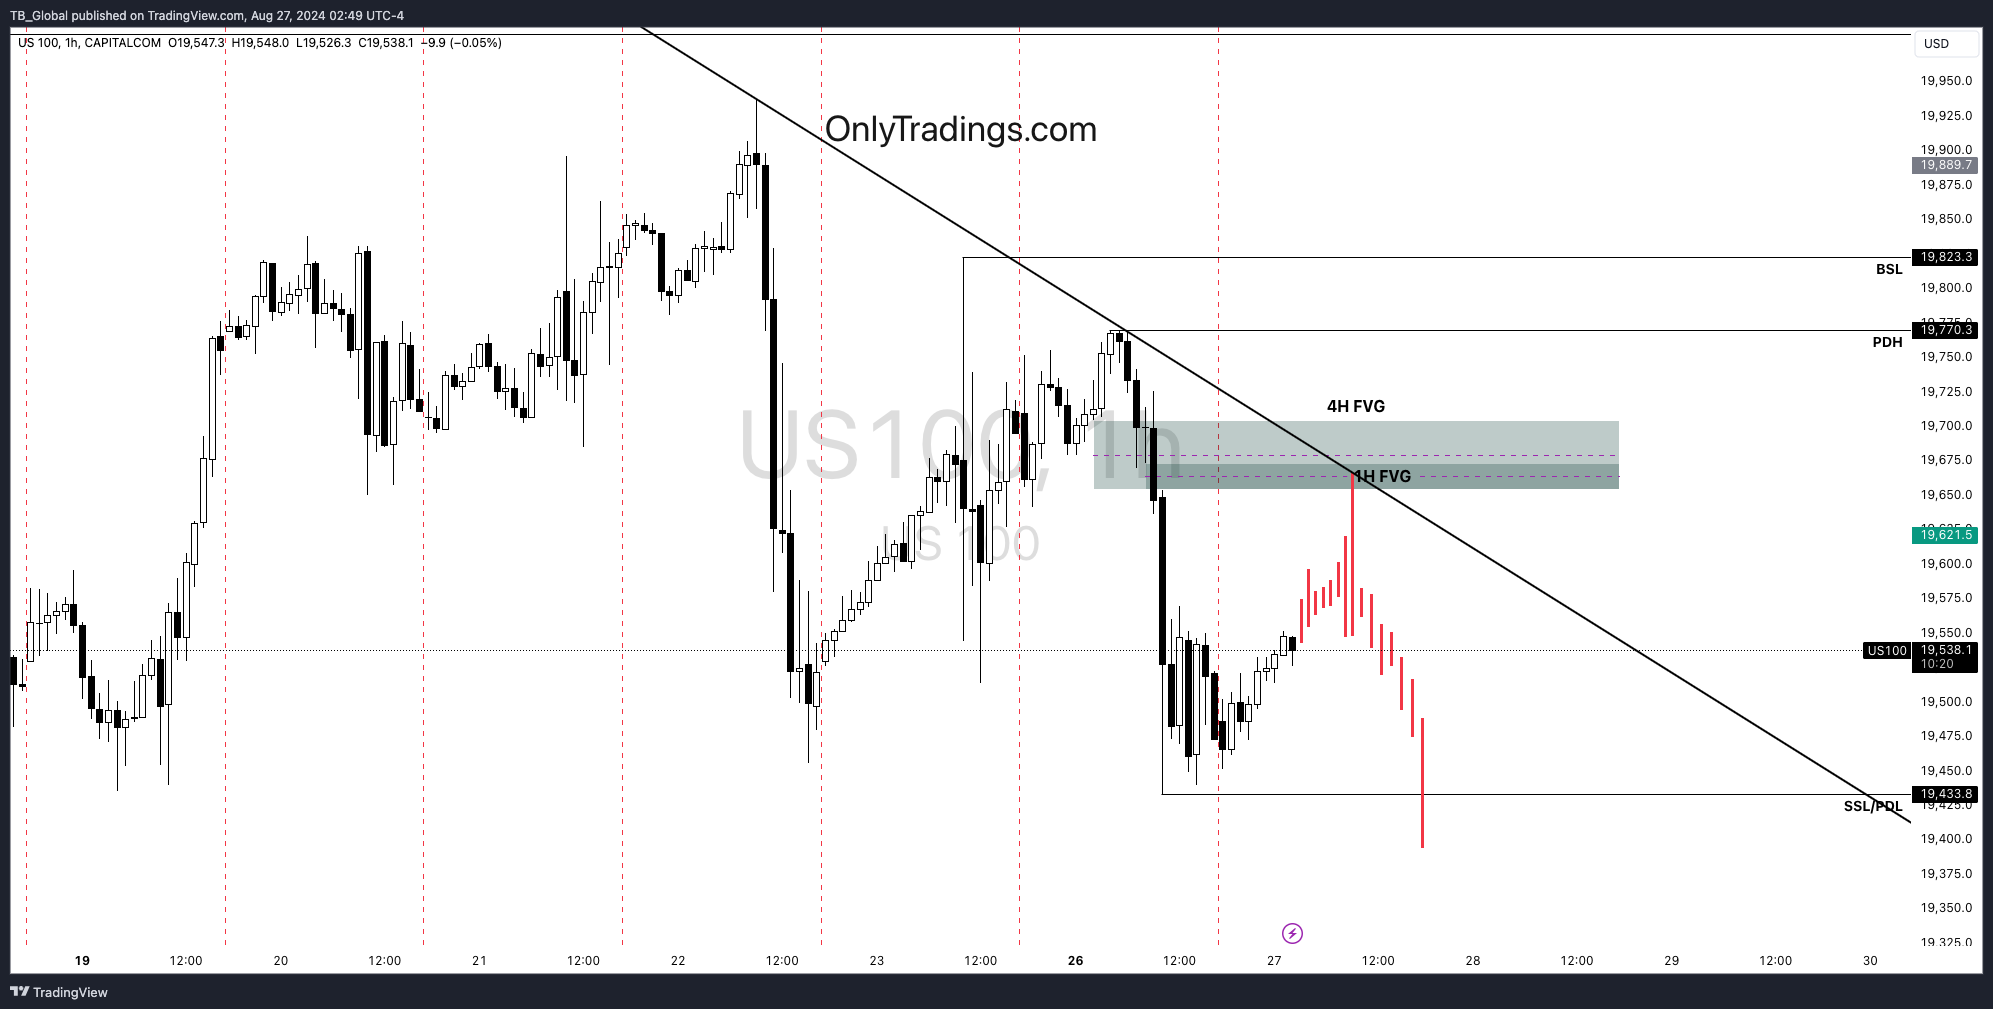
On the 1-hour chart, the price action is currently interacting with a crucial price delivery array (PD array), consisting of an overlapping 1-hour Fair Value Gap (FVG) and a 4-hour FVG. These FVGs are reinforced by the presence of a downward trendline, making this area a key resistance zone. The confluence of these technical factors suggests that a pullback to the discount zone is highly probable.
To further enhance the probability of this setup, traders should look for a Smart Money Technique (SMT) divergence with the S&P 500 when the price touches the 1-hour FVG. SMT divergence occurs when the US100 and S&P 500 show divergent behavior—one making a new high while the other does not—indicating a potential reversal or continuation in the trend. The occurrence of an SMT divergence at this key level would significantly increase the likelihood of a successful pullback, providing a stronger entry signal for long positions.
5-Minute Timeframe (Entry Analysis):

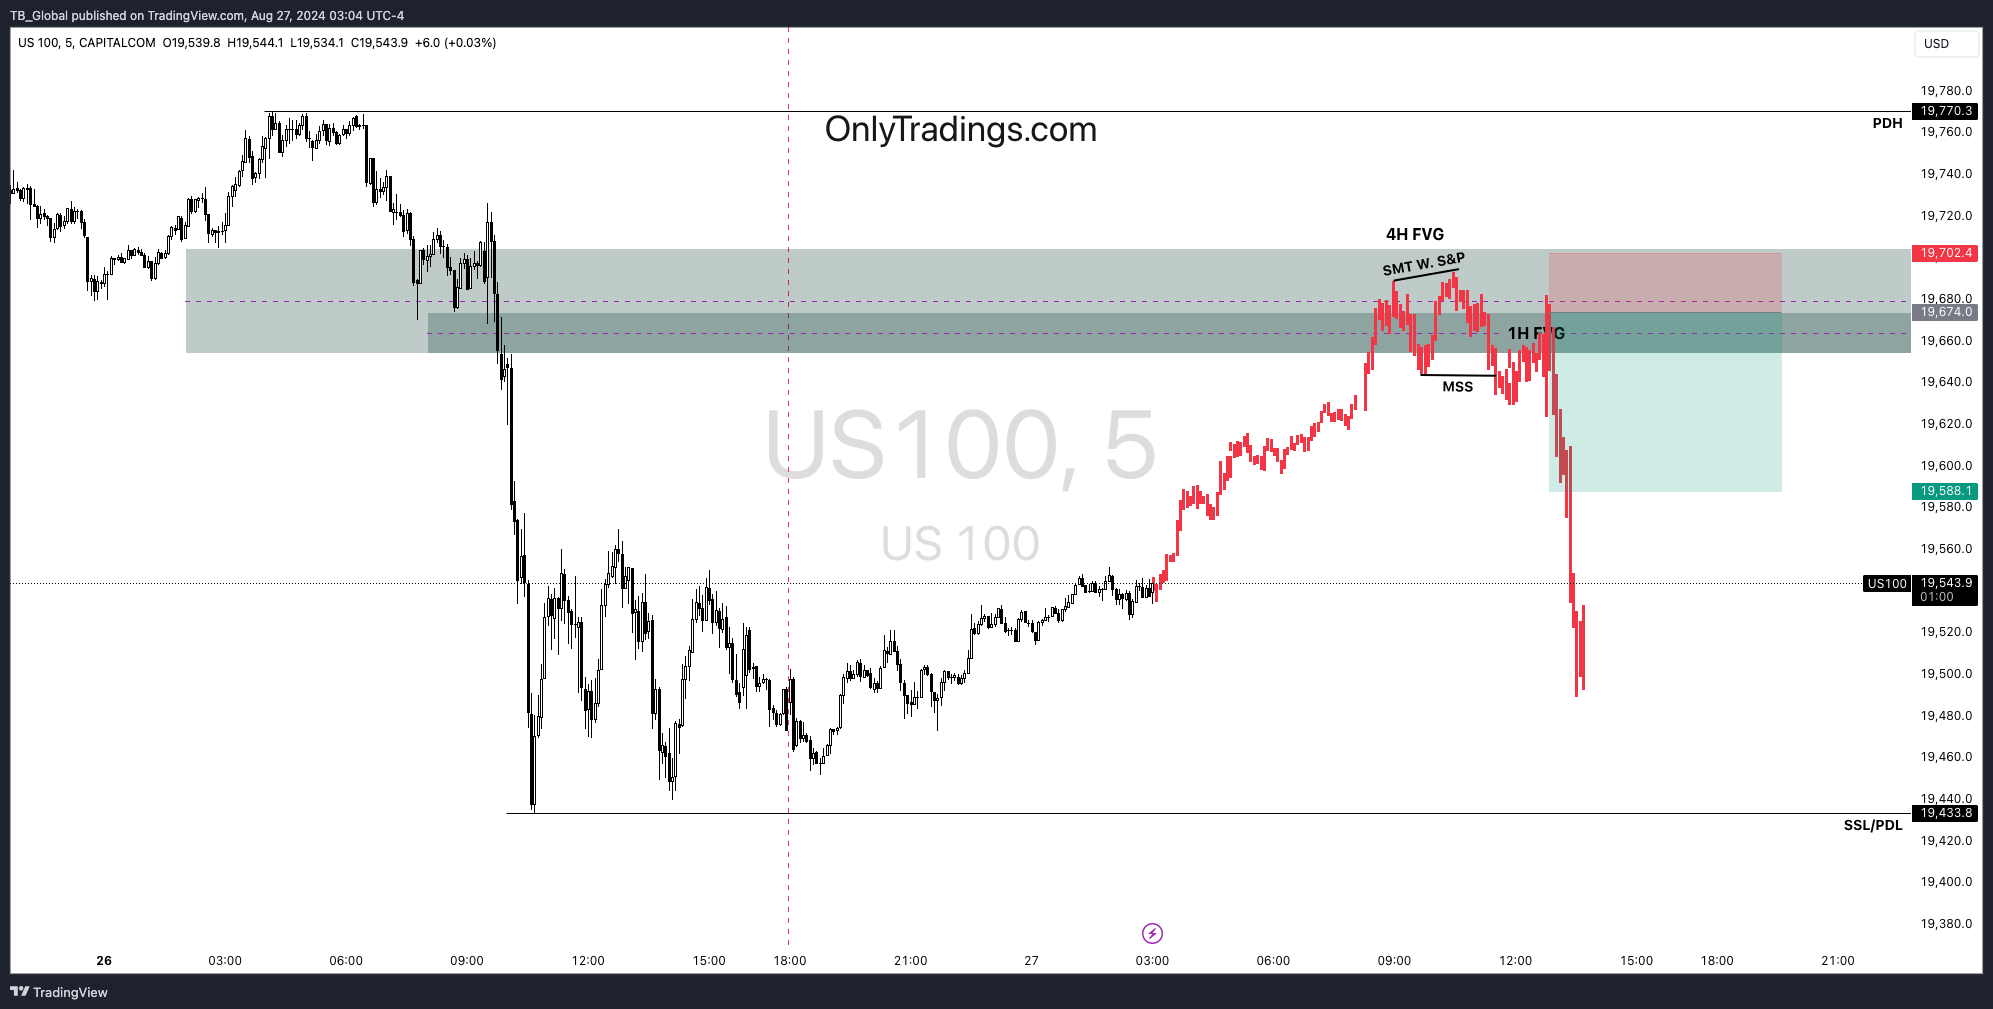
The 5-minute chart offers a precise view for timing entry into the trade. The strategy here is to wait for the price to pull back into the discount zone identified on the daily and 1-hour charts. This pullback, combined with the SMT divergence observed at the 1-hour FVG, will serve as a high-probability setup for entering long positions.
The potential Reward-to-Risk Ratio (RRR) for this trade is approximately 1:3, making it an attractive opportunity. Traders should aim to set their positions to breakeven once the price reaches an RRR of 1:1.5. This move not only protects against potential reversals but also locks in profits as the trade progresses.
Additionally, traders can monitor the 5-minute chart for any signs of bullish momentum, such as bullish engulfing patterns or other reversal signals within the discount zone. These signals, combined with the overall analysis, would further validate the entry and enhance the potential for a profitable trade.
Conclusion:
The US100 maintains a bullish outlook with the daily timeframe pointing to further upside potential following a potential pullback. The 1-hour timeframe's key resistance zone, highlighted by overlapping FVGs and a downward trendline, suggests a probable retracement. The occurrence of an SMT divergence with the S&P 500 at this key level will significantly increase the likelihood of a successful pullback, offering a robust entry point for long positions.
Traders should remain vigilant, particularly around the identified PD arrays, and consider the SMT divergence as a critical confirmation signal. The confluence of these technical factors across multiple timeframes underscores the importance of aligning setups for high-probability trade opportunities.

© 2024 onlytradings.com. All rights reserved. The information in this publication is for general informational purposes only and does not constitute professional advice. onlytradings.com assumes no responsibility for errors, omissions, or outcomes related to the use of this information. We maintain a neutral stance on all political matters, providing unbiased content that should not be interpreted as an endorsement of any political party, candidate, or policy. No part of this publication may be reproduced or transmitted without prior written permission. For inquiries, visit www.onlytradings.com.


