Candle Range Theory (CRT)
Understanding and Applying It to Forex, Indices, and BTC/USD
Understanding and Applying It to Forex, Indices, and BTC/USD
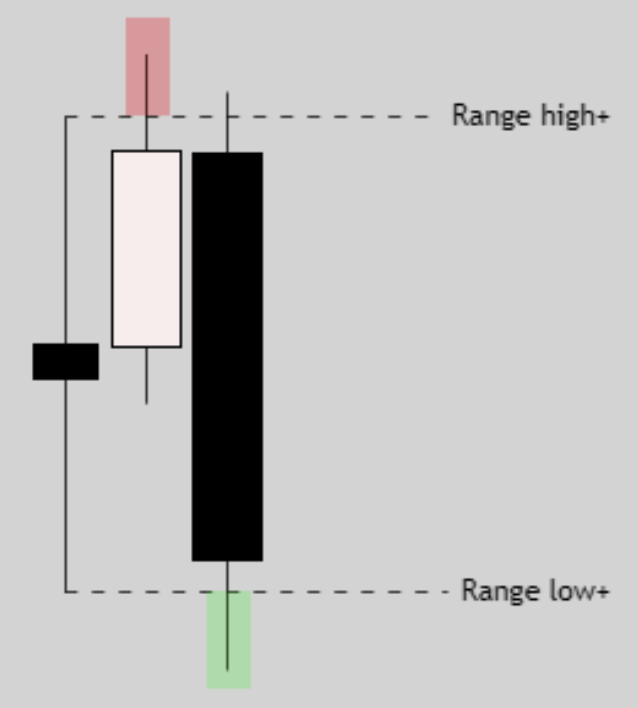
The Candle Range Theory (CRT), introduced by ICT (Inner Circle Trader), provides traders with a framework to predict price movements based on the behavior of individual candles and their ranges. By treating each candle as its own range (with its open, high, low, and close values), traders can identify key price levels and anticipate future movements. CRT works in conjunction with other ICT principles such as Kill Zones, Fair Value Gaps (FVG), and Liquidity Pools to refine entries and exits.
Key Elements of Candle Range Theory (CRT)
#1. Candle as a Range: Every candle, regardless of timeframe, has its own open-high-low-close (OHLC), which defines its range. CRT uses this to forecast potential moves, especially when candles form distinct highs/lows that correlate with liquidity pools or support/resistance zones.
#2. Power of Three:
Accumulation: Price tends to consolidate within a range before a move.
Manipulation: The market may hunt liquidity from the range's highs or lows.
Distribution: This phase sees the market making a final, often impulsive move in the intended direction.
#3. Session Timing (Kill Zones): ICT emphasizes specific timeframes known as Kill Zones:
London Kill Zone (2:00 AM – 5:00 AM ET): Often sets the daily highs or lows, making it crucial for identifying liquidity sweeps and possible trend reversals.
New York Kill Zone (8:00 AM – 11:00 AM ET): This period, which overlaps with the London session, is highly active and provides major price moves.
Asian Kill Zone (8:00 PM – 10:00 PM ET): Less active, but important for tracking retracements or reversals after London and New York's liquidity grabs.
#4. 4H and 1H Candles: CRT is particularly useful on higher timeframes like the 4-hour and 1-hour charts. These timeframes help identify broader ranges, while the 1-hour candles refine entries and exits by zooming in on smaller price movements.
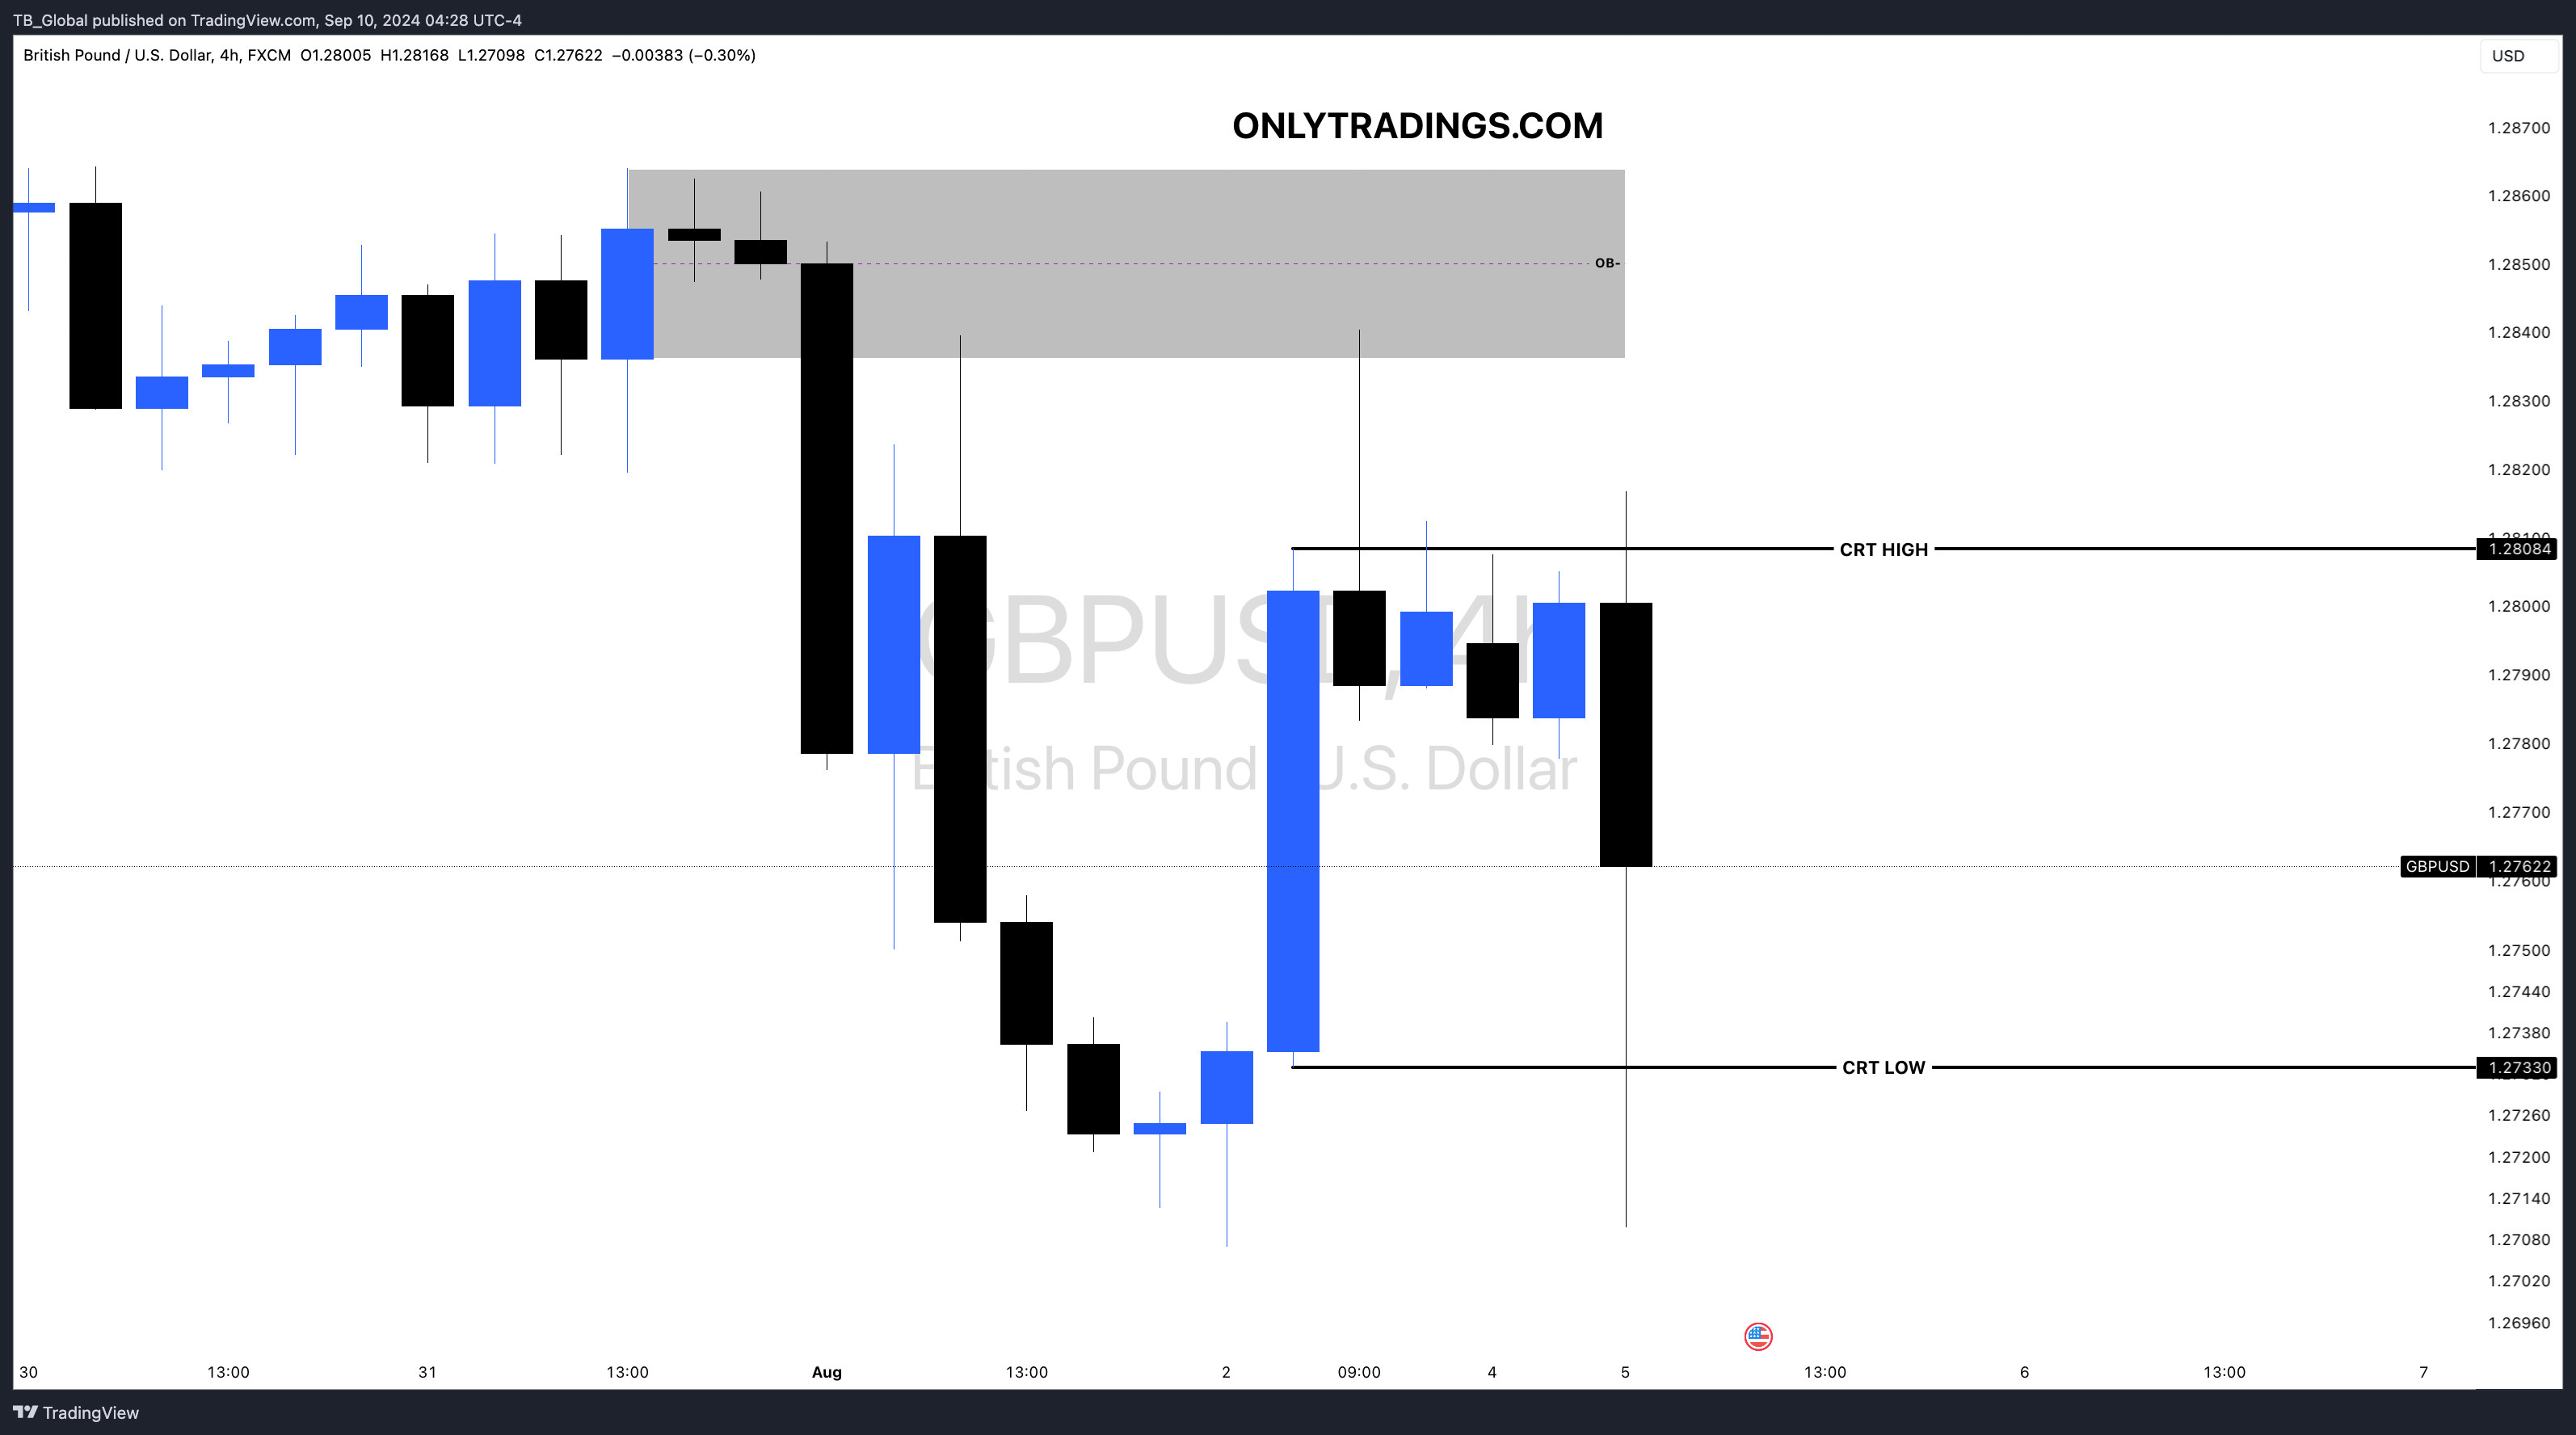
Forex (1-5-9 Candle Sequence)
In Forex, the 1-5-9 candle sequence follows a specific rhythm:
Candle 1: Often marks the start of a new range or significant price action.
Candle 5: Typically represents a midpoint or liquidity reaction zone.
Candle 9: Usually signals the end of the range, signaling potential exhaustion or trend reversal.
This sequence helps traders capture critical price action moments within a defined range, making it easier to anticipate liquidity grabs or shifts in momentum.
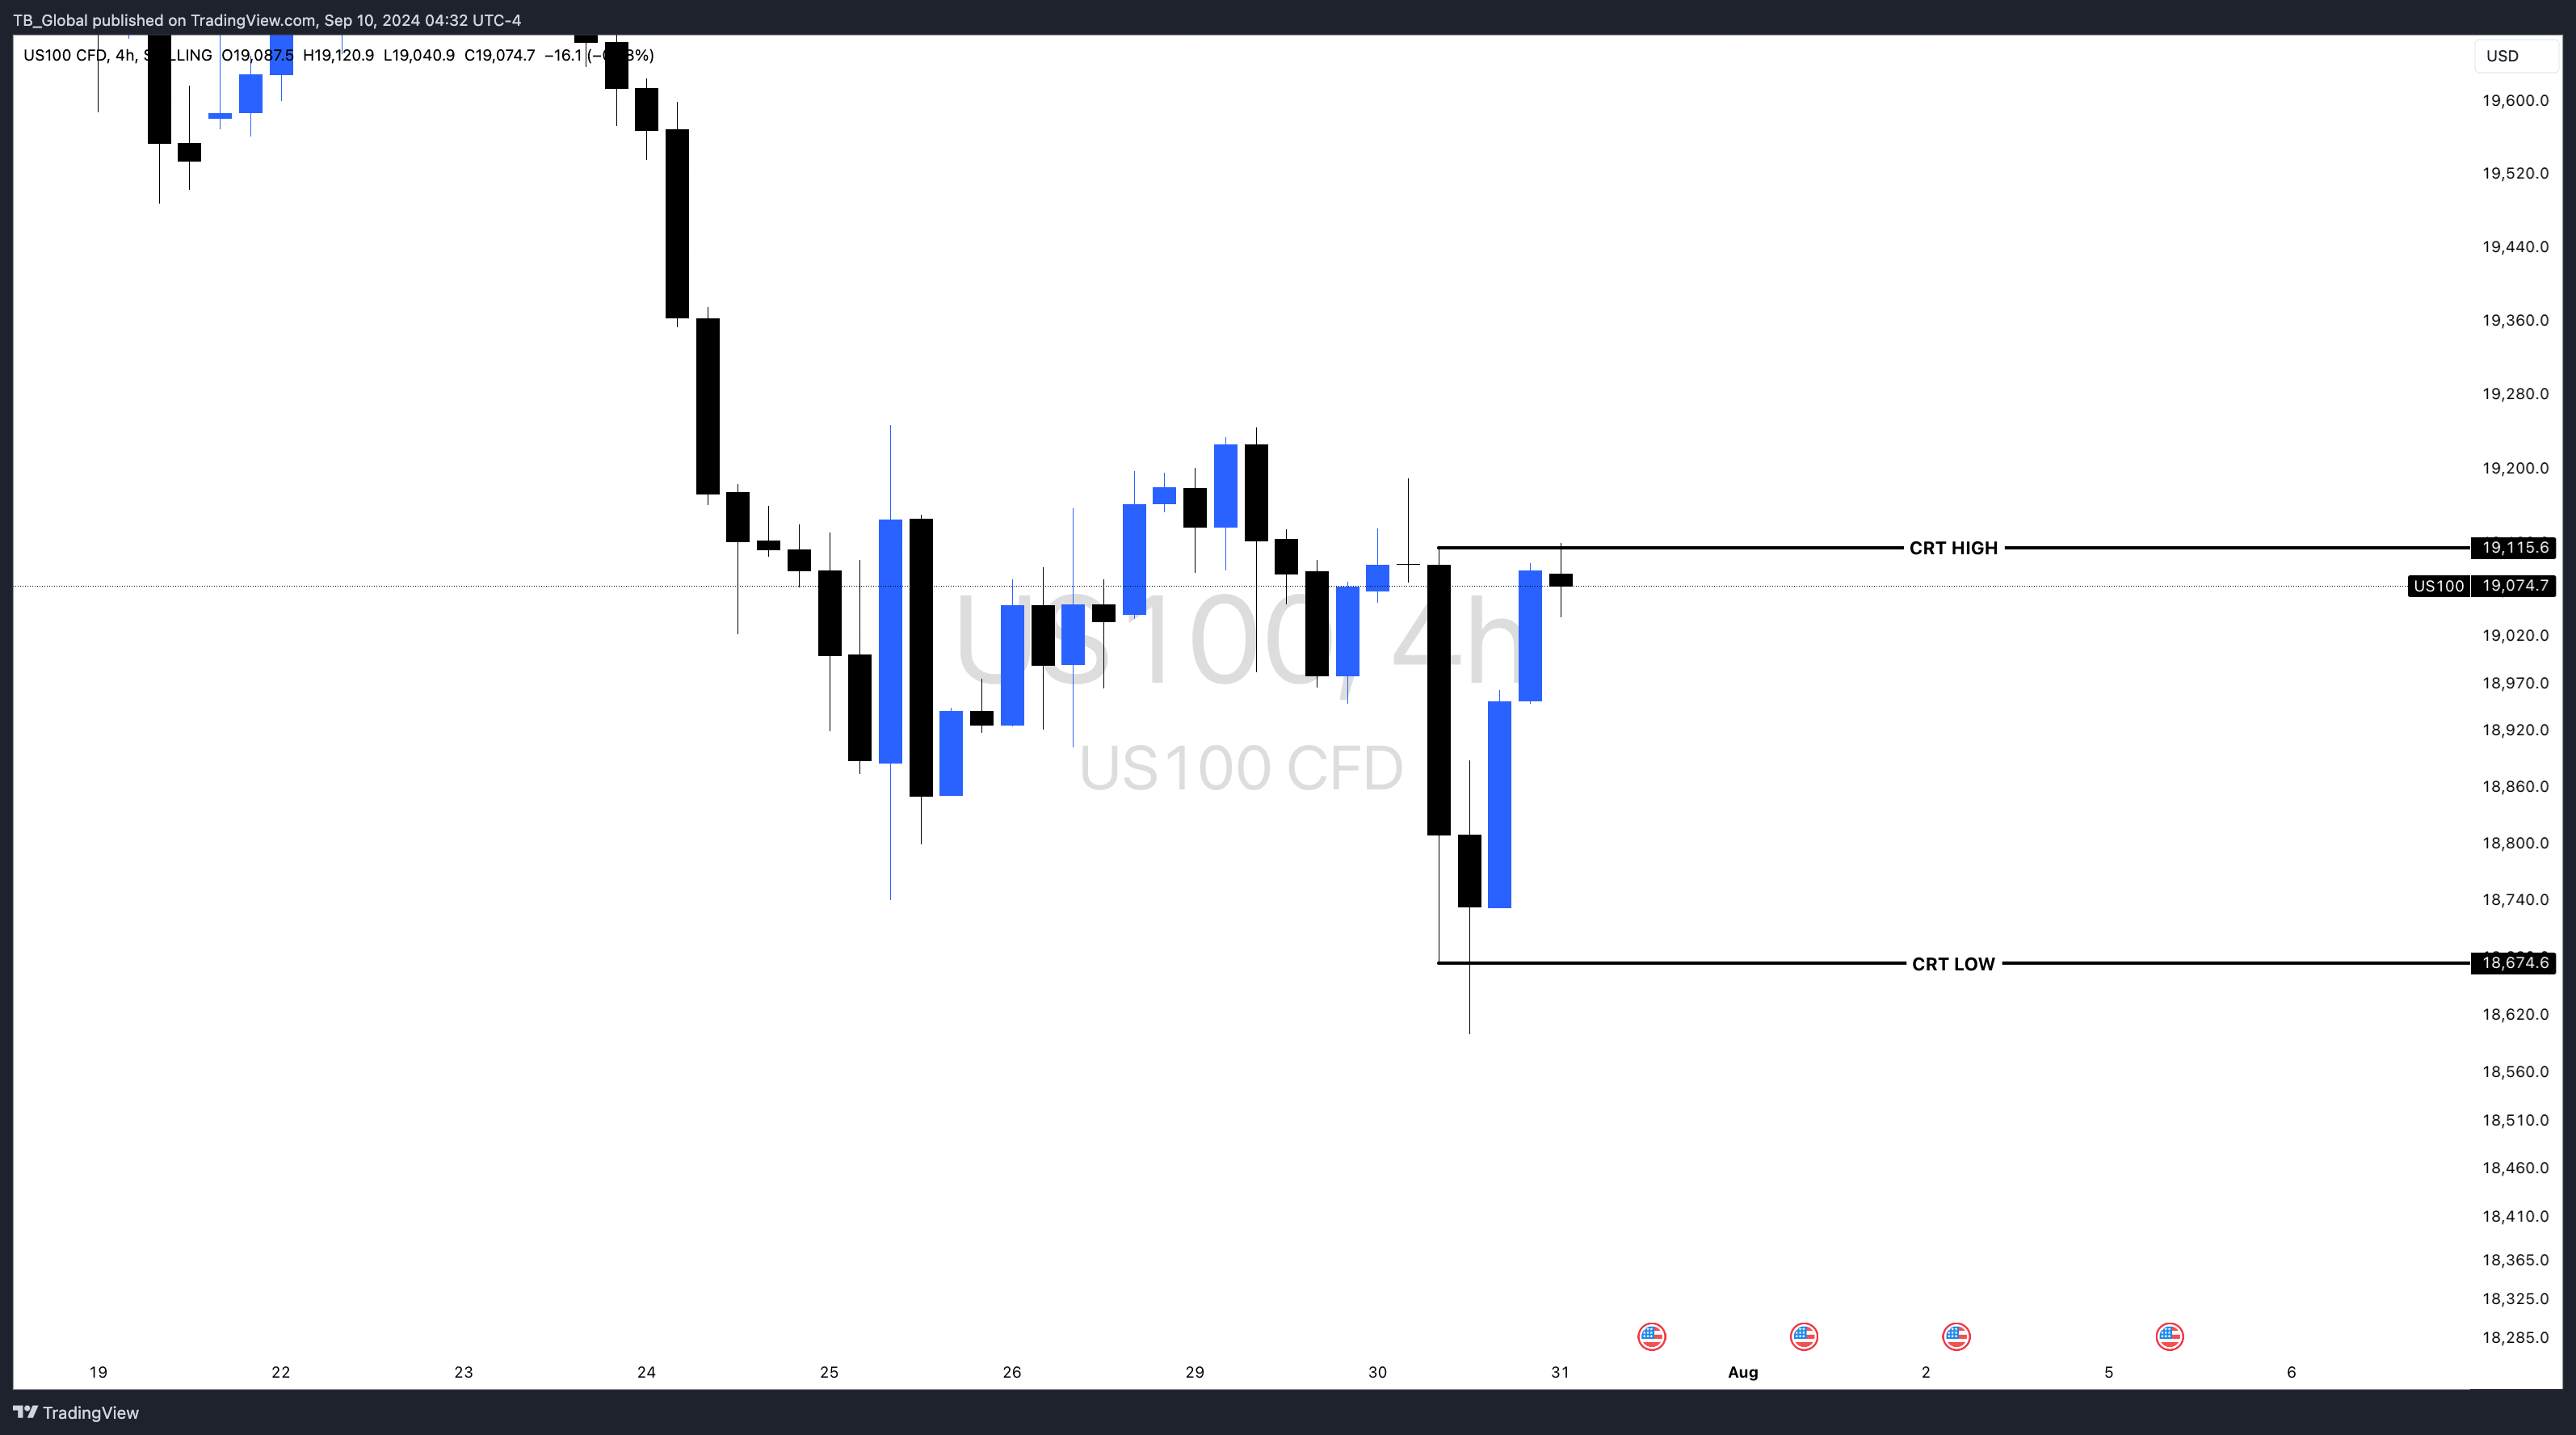
Indices (2-6-10 Candle Sequence)
For Indices, the 2-6-10 candle pattern works similarly:
Candle 2: Indicates initial price reaction post-impulse.
Candle 6: This midpoint often coincides with liquidity pools or key support/resistance.
Candle 10: Marks the potential exhaustion or breakout point of a range.
Both 1-5-9 (Forex) and 2-6-10 (Indices) sequences are valuable for aligning trades with market rhythms, especially during volatile sessions like the New York Kill Zone (8:00 AM – 11:00 AM ET).

Application to BTC/USD
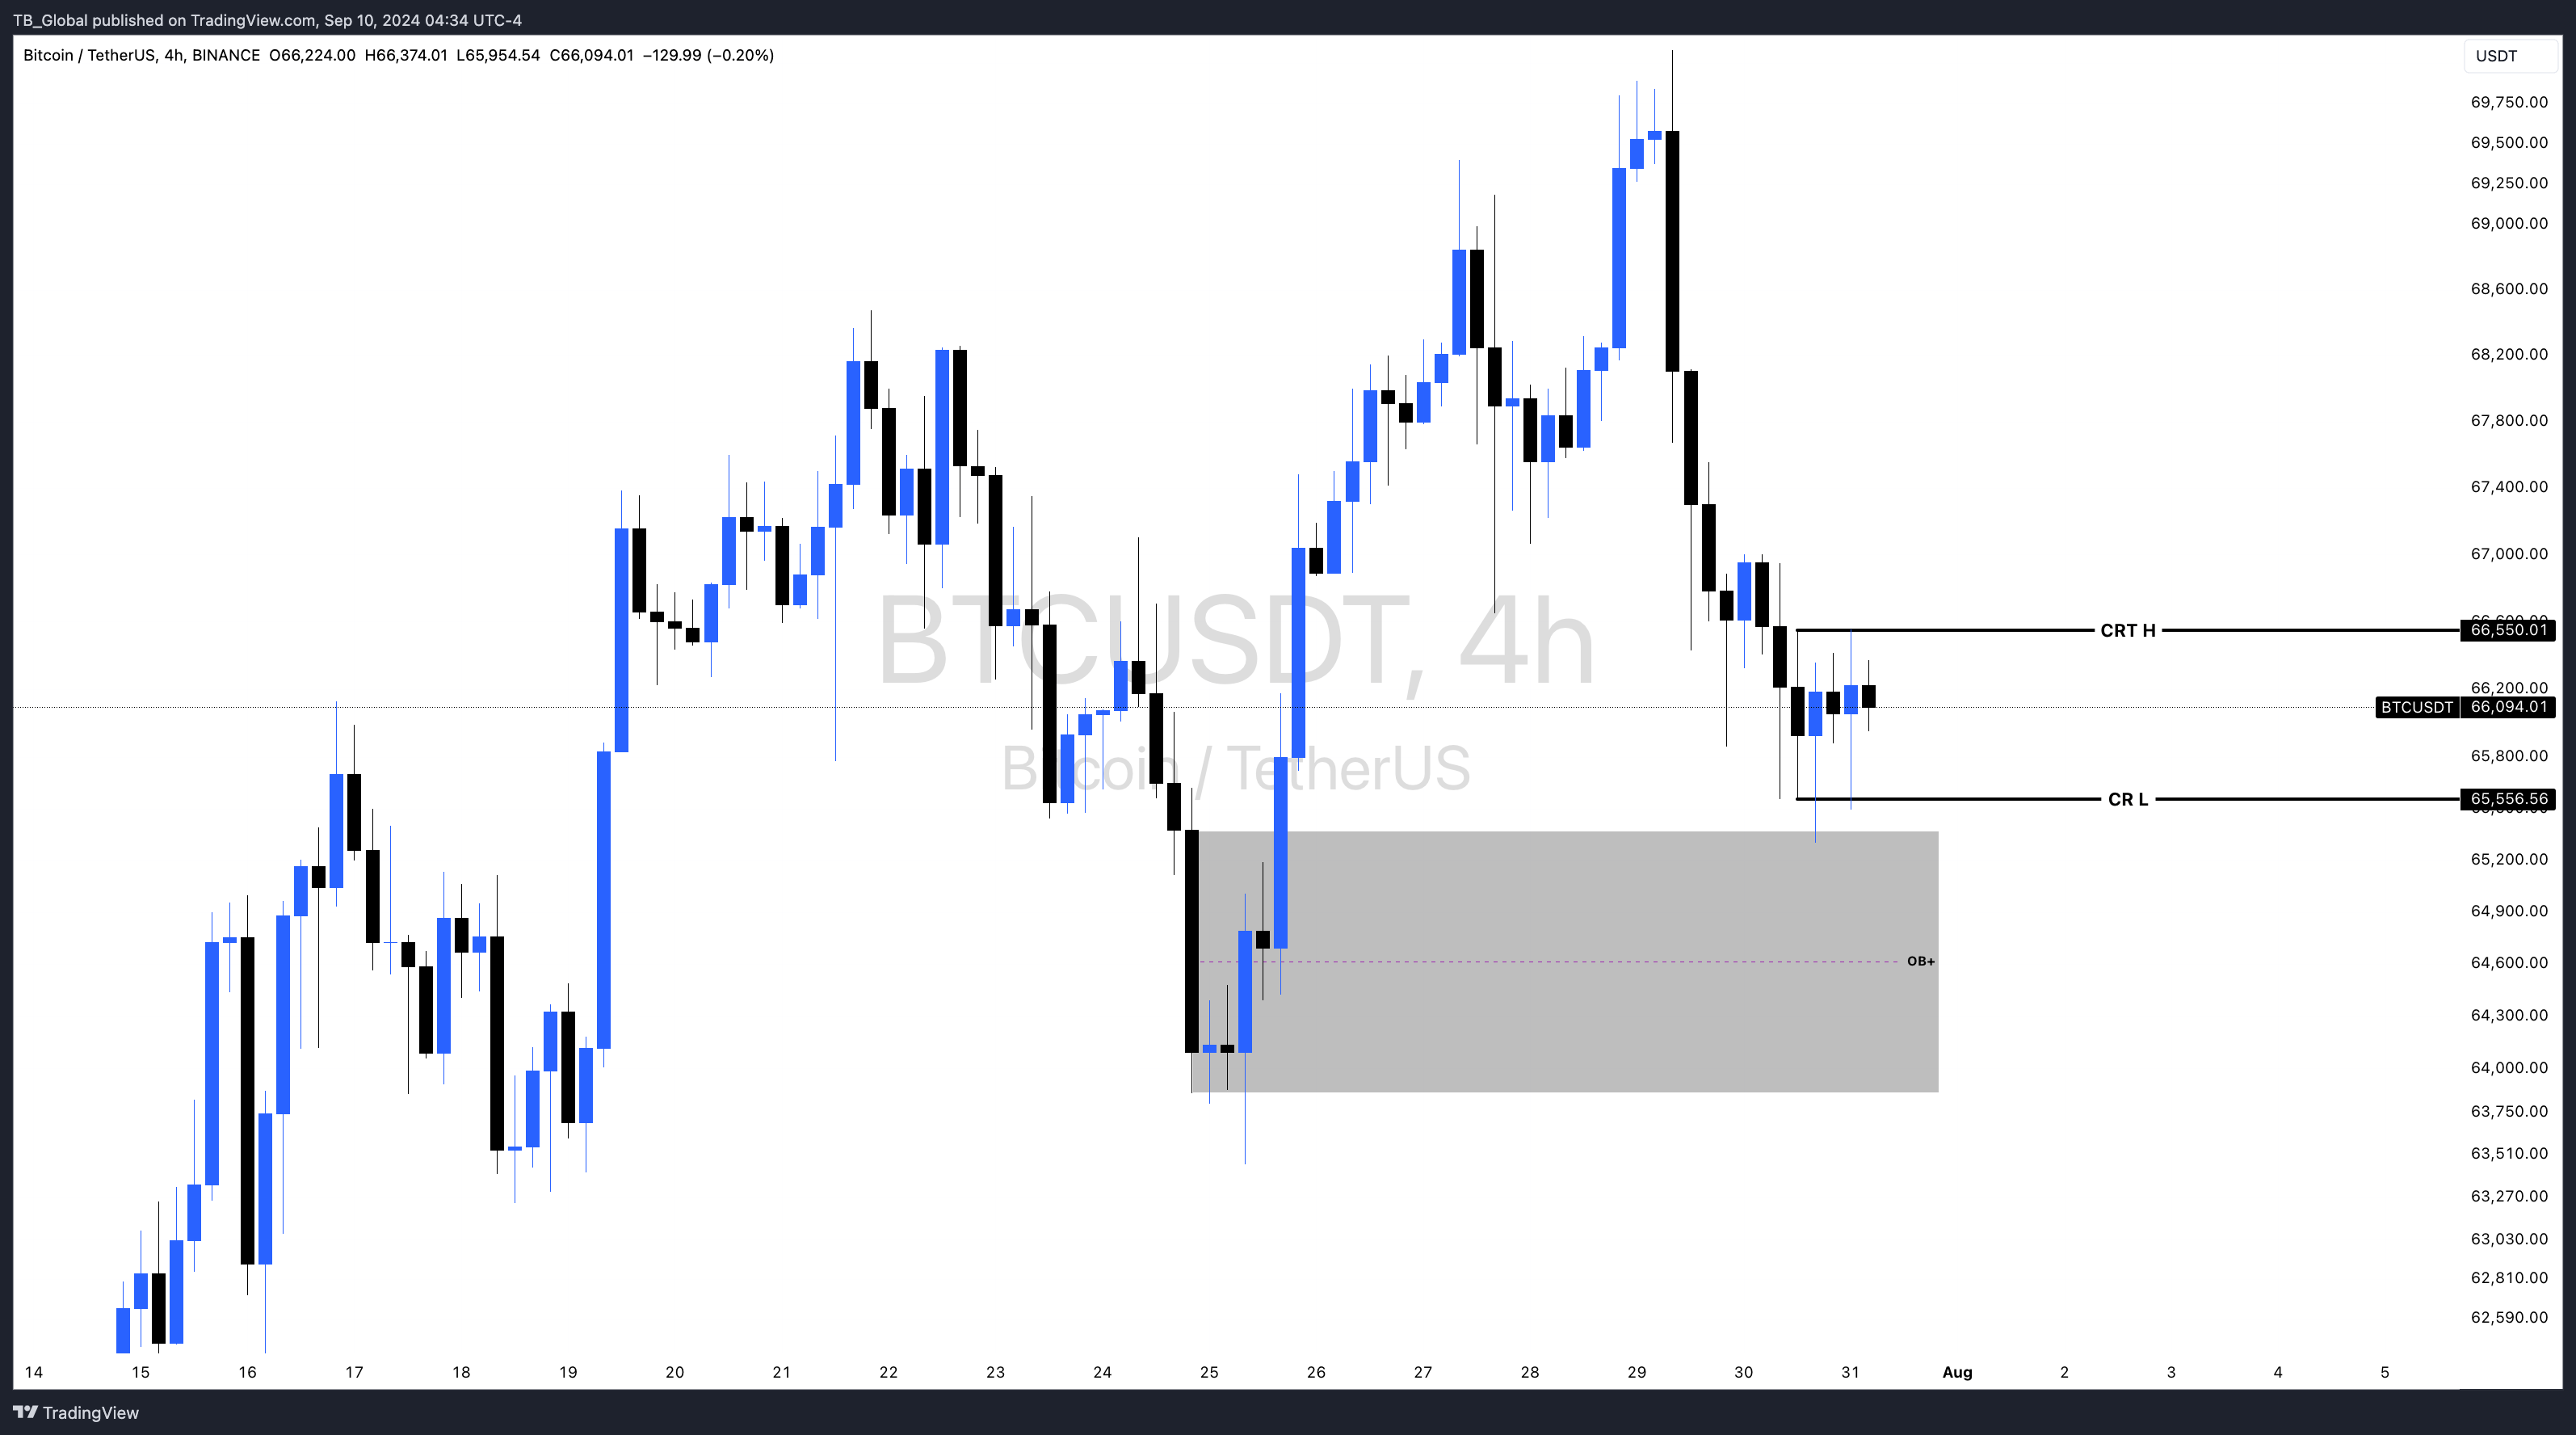
For BTC/USD, the Candle Range Theory can be used to identify key market moments:
#1. Identify the Range: Start by defining the range on the 4H chart. You can use the 1-5-9 sequence (borrowed from the Forex model) to mark key moments:
Candle 1 starts the range.
Candle 5 indicates liquidity grabs or reactions, often aligning with an FVG.
Candle 9 signals the potential range conclusion or continuation.
#2. Time Your Trades: Leverage the London and New York Kill Zones to look for liquidity sweeps or setups within the defined range. For example, BTC/USD tends to show volatility during these sessions, and a liquidity grab during the London Kill Zone can lead to trend continuation in the New York session.
#3. Lower Timeframes for Precision: After identifying the range on the 4-hour chart, zoom into the 1-hour timeframe to fine-tune entries and exits, using candles 2, 6, and 10 from the indices strategy.
Example Strategy:
Define the Range: Use the 4H chart to mark the high and low of a candle range.
Liquidity Sweep in London Kill Zone: Watch for price to sweep the liquidity above/below the range during the London Kill Zone.
Entry in New York Kill Zone: After the liquidity sweep, enter after confirmation on the 1-hour chart during the New York Kill Zone.
Exit: Target liquidity pools or Fair Value Gaps (FVG) from higher timeframes, ensuring to align with the key candle sequences (1-5-9 for Forex or 2-6-10 for Indices).
Conclusion:
This combined approach using Candle Range Theory and ICT concepts will help refine your trading strategy, offering high-probability entries and exits based on liquidity, session timing, and market structure. Be sure to remain mindful of session overlaps and the volatility these periods bring to optimize your trade setups.

© 2024 onlytradings.com. All rights reserved. The information in this publication is for general informational purposes only and does not constitute professional advice. onlytradings.com assumes no responsibility for errors, omissions, or outcomes related to the use of this information. We maintain a neutral stance on all political matters, providing unbiased content that should not be interpreted as an endorsement of any political party, candidate, or policy. No part of this publication may be reproduced or transmitted without prior written permission. For inquiries, visit www.onlytradings.com.


