
Mastering the ICT Unicorn Strategy: A Comprehensive Guide to Fair Value Gaps, Breaker Blocks, and Liquidity Draws
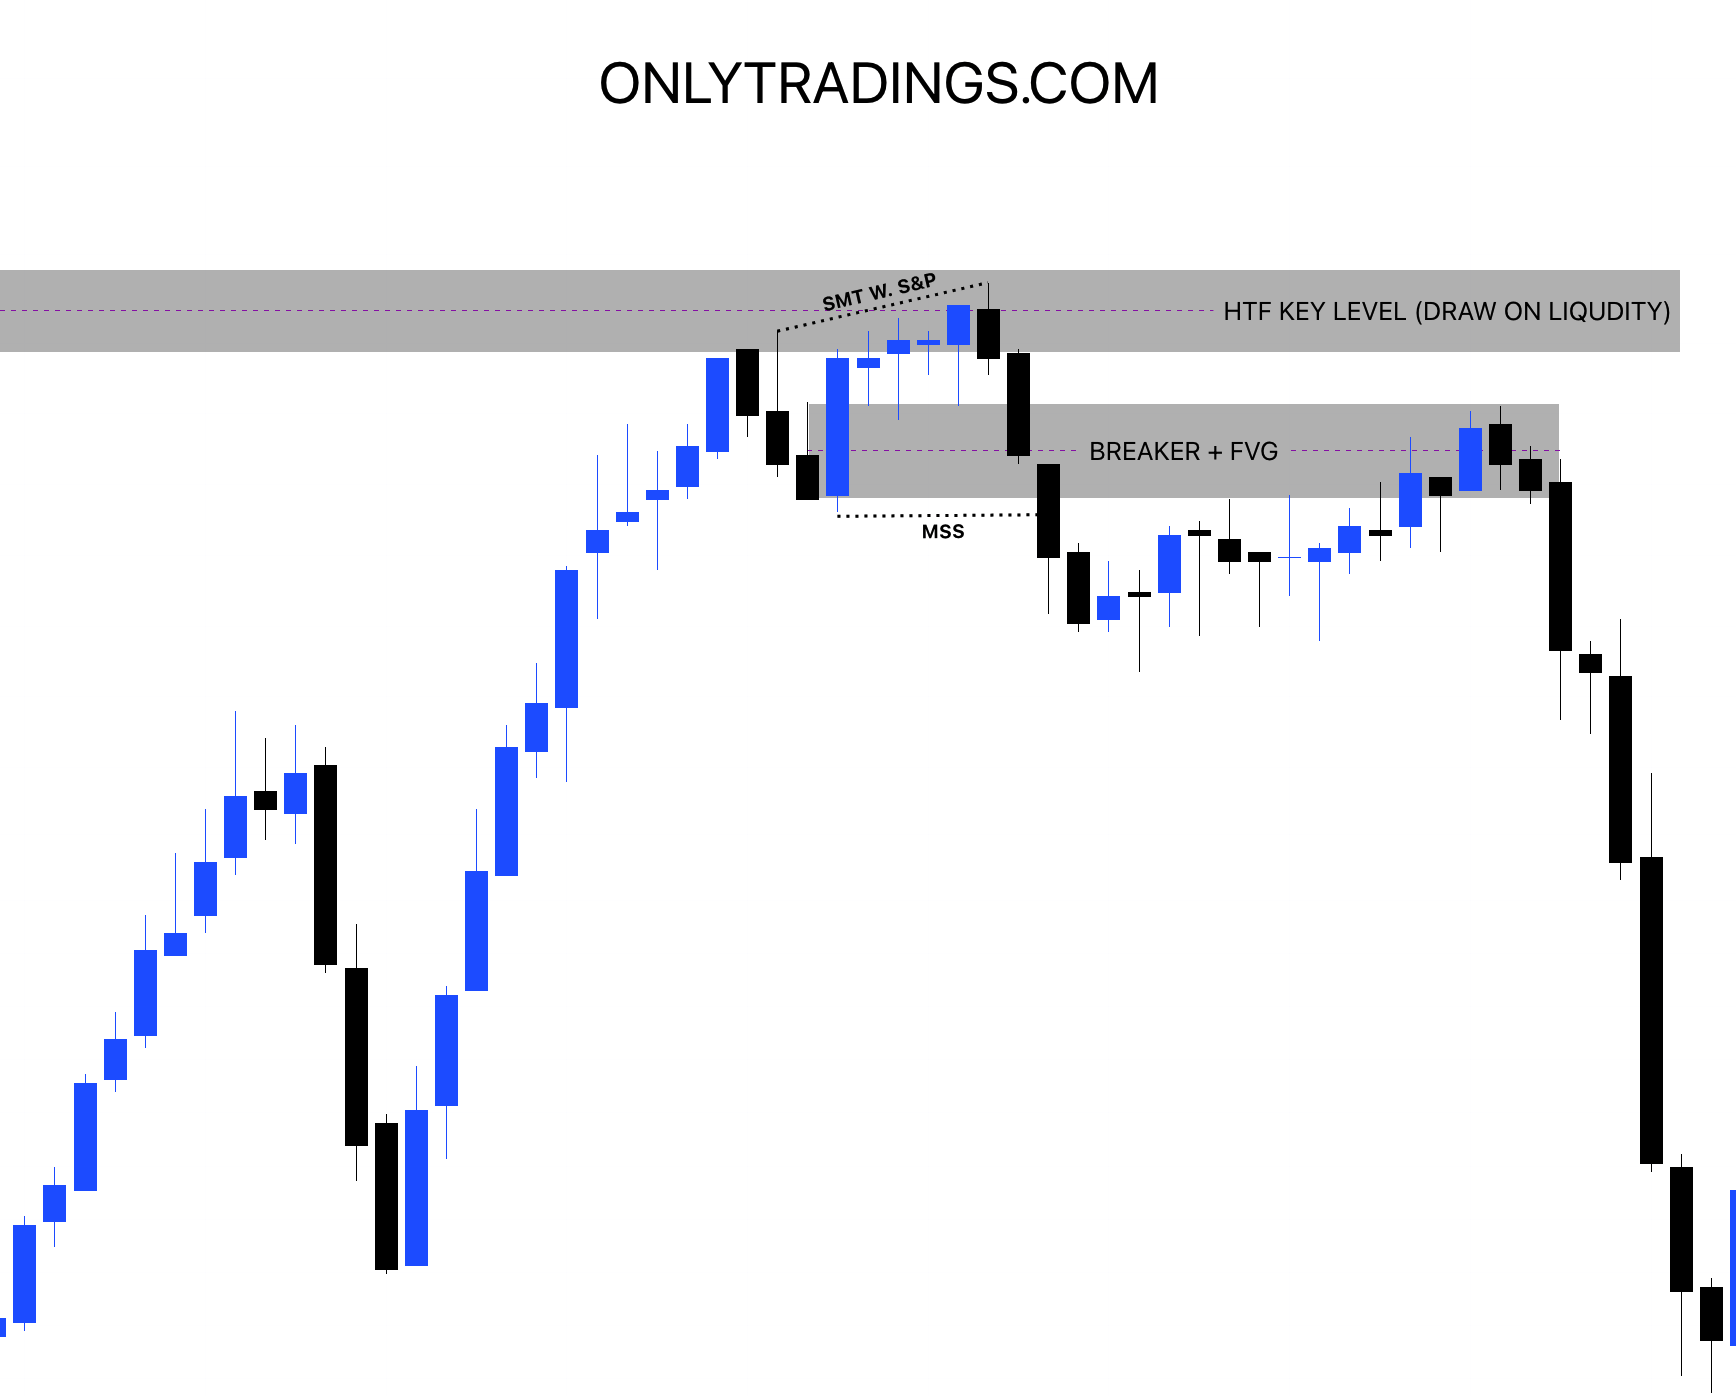
The ICT Unicorn strategy is a powerful method for predicting significant price movements in various financial markets, including stocks, crypto, forex, and futures. It draws on key concepts from Inner Circle Trader (ICT) methodologies, notably Fair Value Gaps (FVGs) and Breaker Blocks (BBs).
Key Concepts of the ICT Unicorn Strategy:
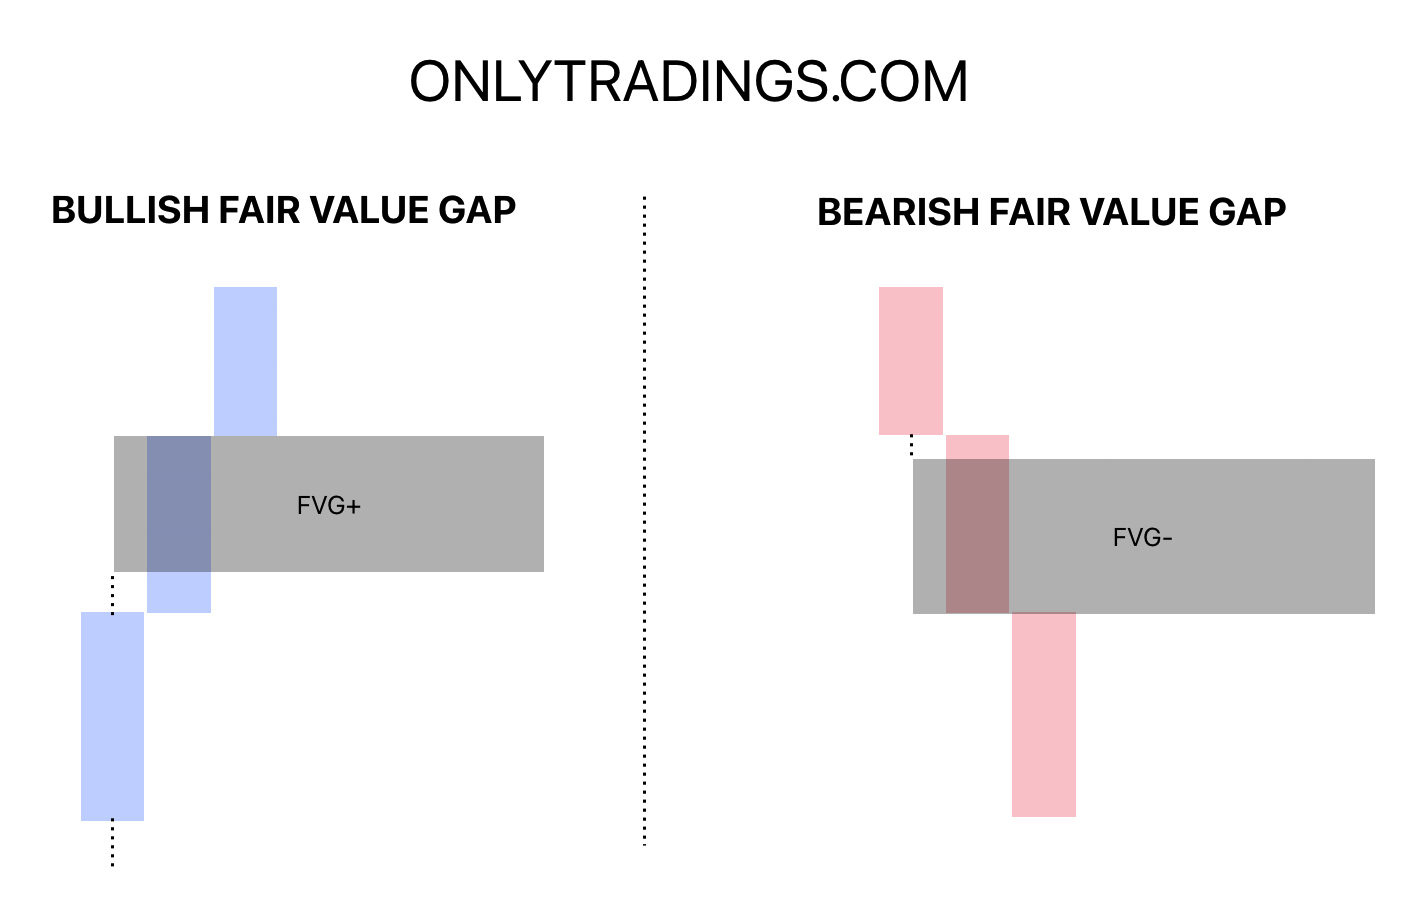
Fair Value Gaps (FVGs): These occur when the price moves too quickly, leaving imbalances in the market between buyers and sellers. FVGs are gaps that form between the wicks of the first and third candles in a three-candle pattern, which act as potential zones for price retracement.
- A Bullish FVG occurs with three consecutive bullish candles. The low of the third candle must not overlap with the high of the first.
- A Bearish FVG involves three consecutive bearish candles. The high of the third candle must not overlap with the low of the first.
Breaker Blocks (BBs): These are derived from failed Order Blocks (OBs). Breaker blocks act as key zones for potential reversals, much like when broken resistance becomes support and vice versa.
- A Bullish Breaker Block happens when a bearish order block is invalidated, signaling potential upward movement.
- A Bearish Breaker Block occurs when a bullish order block is invalidated, signaling potential downward movement.
How to Identify the ICT Unicorn Setup:
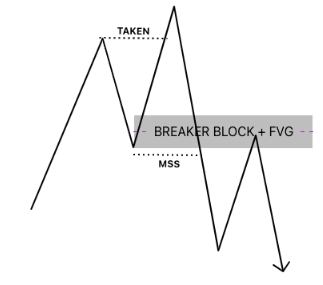
The Unicorn setup combines both these concepts: an FVG overlapping a Breaker Block.
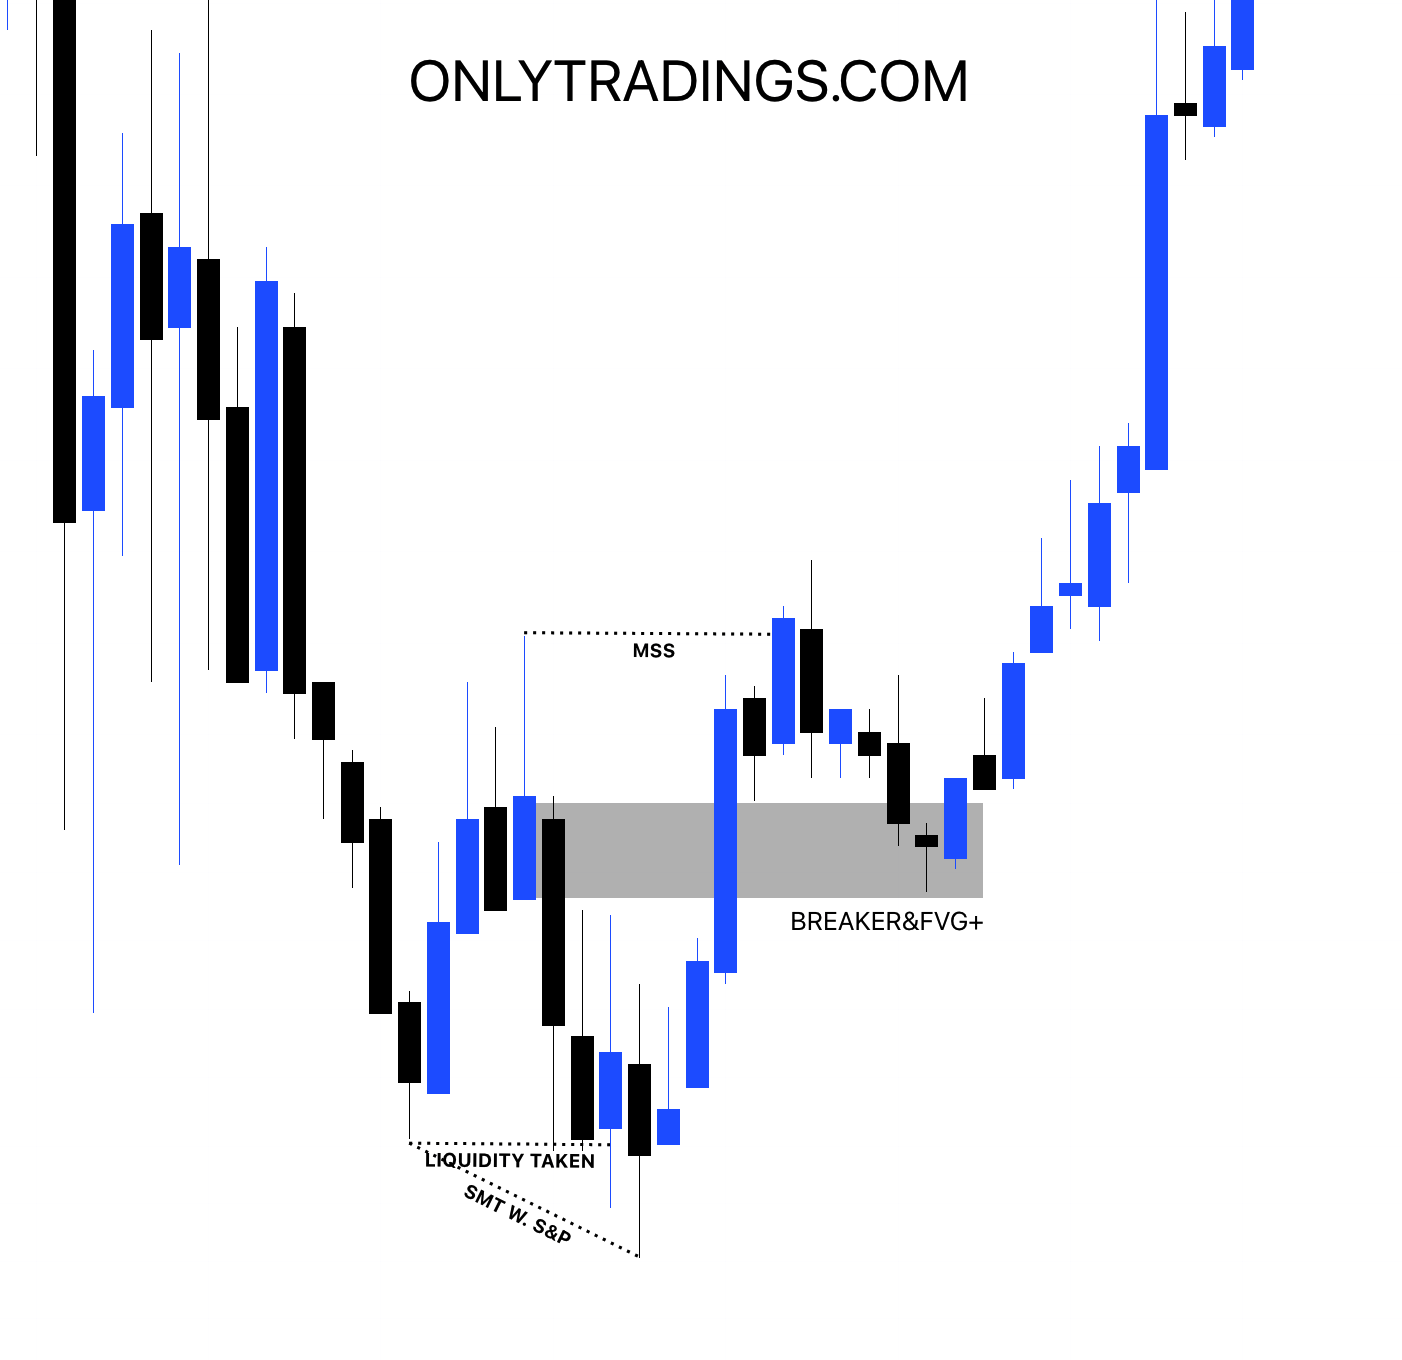
- Bullish ICT Unicorn Setup: Occurs when a bullish breaker block overlaps with a bullish fair value gap.
- Bearish ICT Unicorn Setup: Occurs when a bearish breaker block overlaps with a bearish fair value gap.
Example of Bearish ICT Unicorn Setup:

Example of Bullish ICT Unicorn Setup:
How to Trade the ICT Unicorn Strategy:
For Long Trades: Wait for price to retrace to the identified bullish FVG. Enter long positions with a stop loss placed below the bullish breaker block. A 1:2 risk-to-reward ratio is recommended.
For Short Trades: Wait for price to retrace to the identified bearish FVG. Enter short positions with a stop loss placed above the bearish breaker block. Again, aim for a 1:2 risk-to-reward ratio.
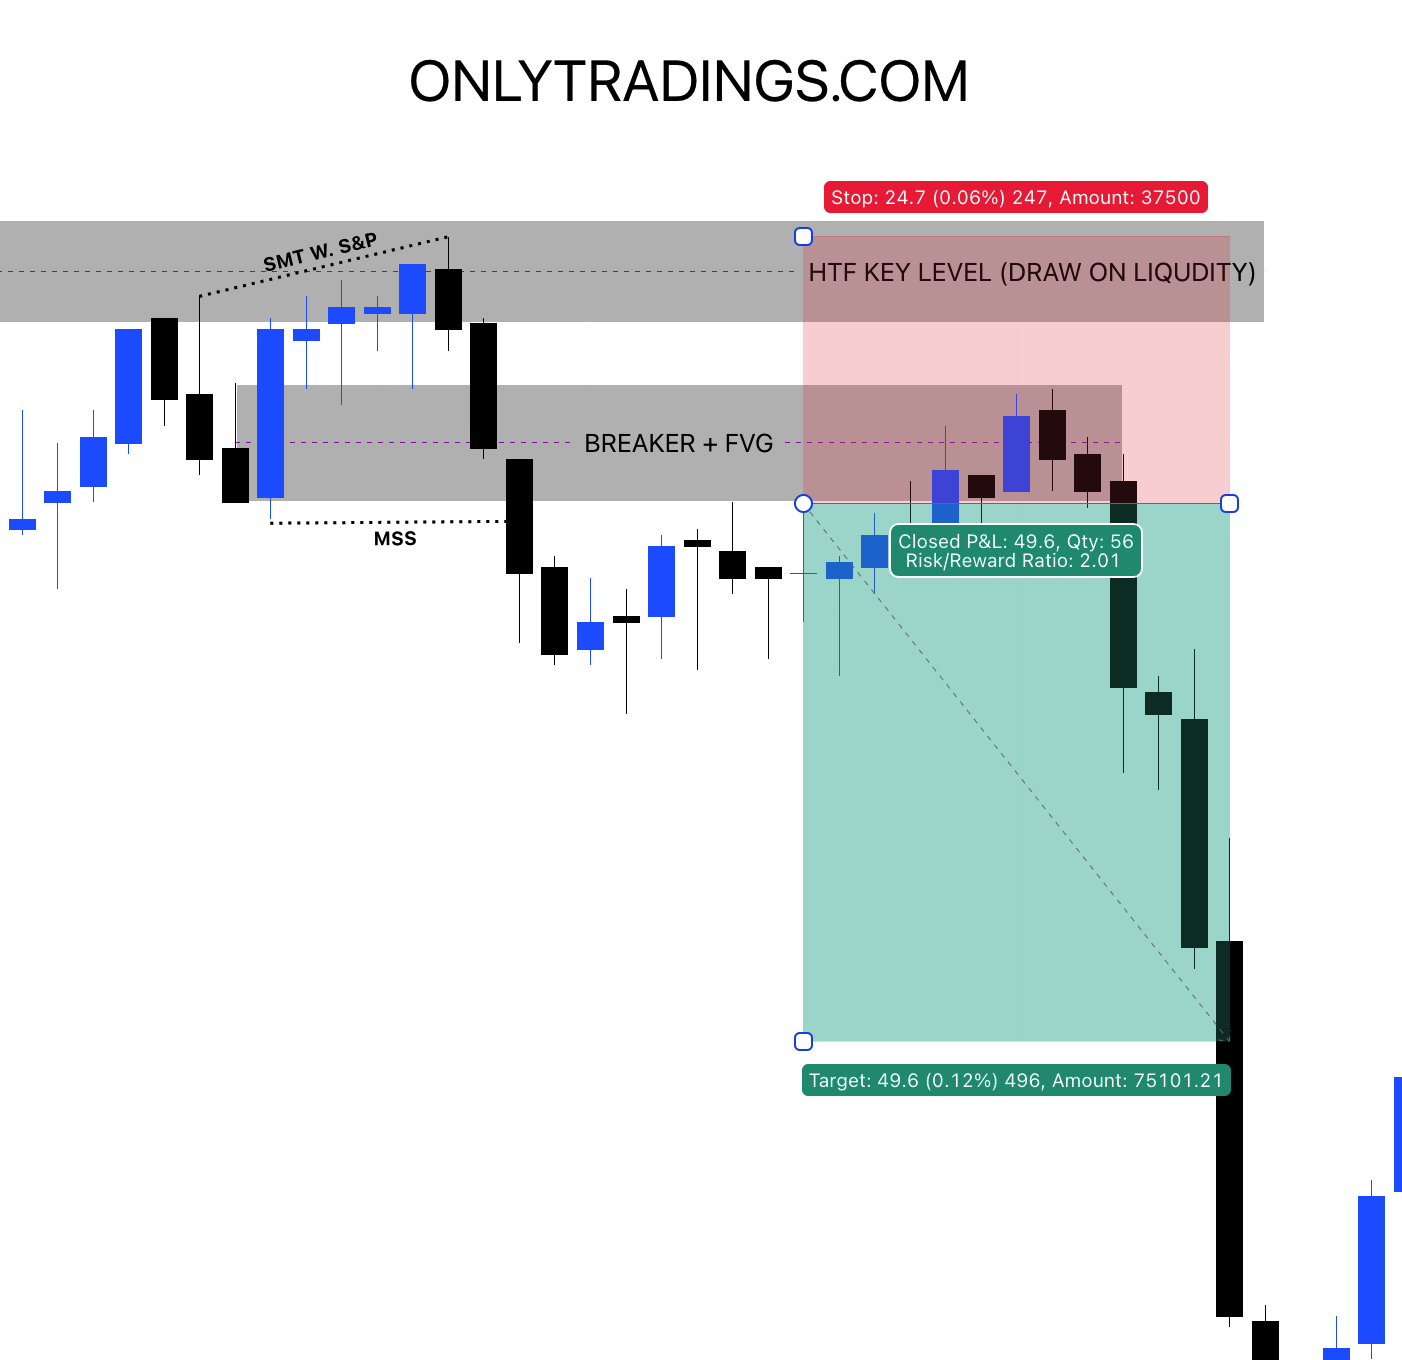
Avoiding Poor ICT Unicorn Setups:
While 100% accuracy is unattainable, traders can increase their success by aligning their trades with market bias. If your bias is bullish, only seek out bullish Unicorn setups; if bearish, only look for bearish setups. Additionally, it’s crucial to confirm your setups on higher timeframes to ensure that the overall market trend supports your trade. For instance, if trading the Unicorn setup on the 5-minute chart, confirm that the 15-minute and 30-minute timeframes support your trade direction.

Best Time to Use the ICT Unicorn Strategy:
This strategy works best during periods of market volatility, especially during the New York, London, and Asia trading sessions, as these times often see sharp price movements.
Timeframes for the ICT Unicorn Strategy:
The ICT Unicorn strategy is flexible across all timeframes, but traders should always confirm their trades using higher timeframes to ensure alignment with the overall market trend.
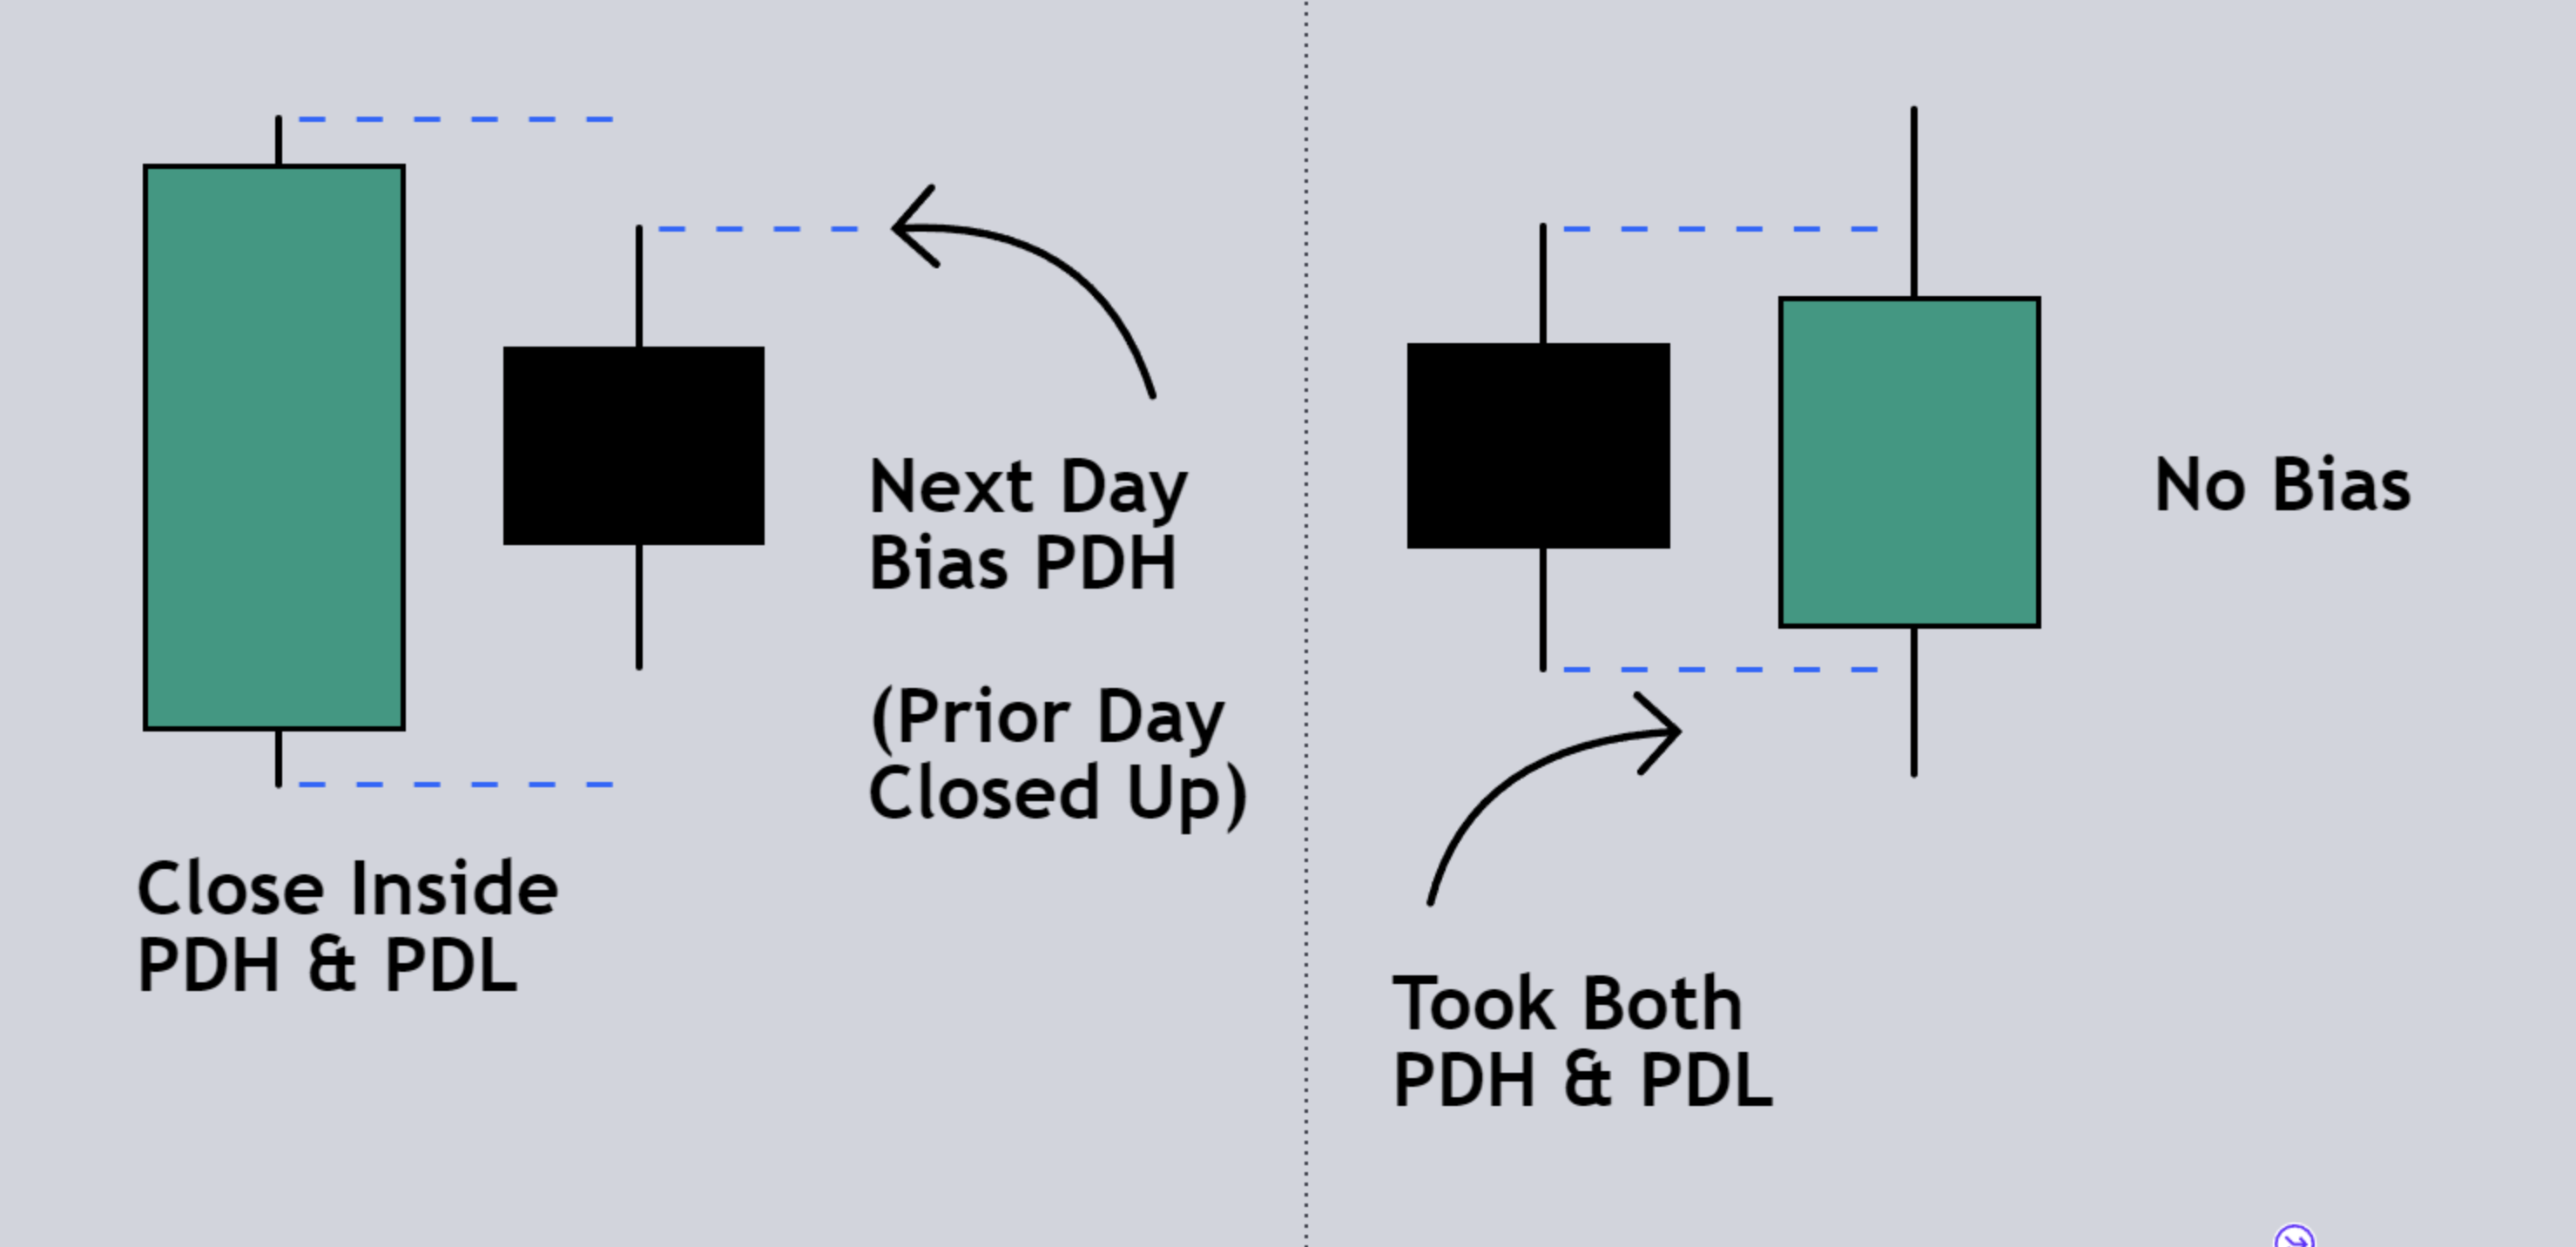

Types of Draw on Liquidity:
In ICT, liquidity zones act as magnets for price movement. Below are key types of liquidity draws, which can guide traders on potential zones where liquidity may be targeted:
#1. Equal Highs / Equal Lows: Price is likely to hunt liquidity at these levels.
#2. Fair Value Gaps (FVGs), Inverse Fair Value Gaps (iFVGs), Breaker Blocks (BPRs): Areas of imbalance often act as key zones for retracement or reversal.
#3. Previous Day High/Low, Previous Week High/Low: These levels serve as potential liquidity pools.
#4. Range High/Low: Often, price hunts one side of a range before reversing.
#5. Asia Range High/Low: Significant for price action during the London or New York sessions.
#6. Buy-Side Liquidity / Sell-Side Liquidity: Price moves to target liquidity on either side.
#7. Original Consolidation: Price may retrace to consolidation zones before resuming a trend.
Incorporating this knowledge into your trading plan can enhance your ability to identify high-probability setups, mitigate risks, and align with the overall market direction.

© 2024 onlytradings.com. All rights reserved. The information in this publication is for general informational purposes only and does not constitute professional advice. onlytradings.com assumes no responsibility for errors, omissions, or outcomes related to the use of this information. We maintain a neutral stance on all political matters, providing unbiased content that should not be interpreted as an endorsement of any political party, candidate, or policy. No part of this publication may be reproduced or transmitted without prior written permission. For inquiries, visit www.onlytradings.com.

