Combining Volume Analysis with Support & Resistance and Trendlines for Trading Success
Introduction
Volume analysis, support and resistance (S&R), and trendlines are essential tools in technical analysis that, when combined, can significantly enhance your trading strategy. Understanding how volume interacts with key price levels and trendlines allows traders to gauge the strength and sustainability of price movements, thus increasing the probability of making successful trades. This comprehensive approach helps confirm breakouts, identify reversals, and validate trend strength, providing a robust framework for better trading decisions.
1. The Basics: Understanding Volume Analysis
Volume represents the total number of shares or contracts traded within a specific period. It’s a direct reflection of market activity and sentiment, indicating the level of interest among traders:
High Volume: Suggests strong conviction and participation, often confirming significant price movements.
Low Volume: Indicates uncertainty or lack of interest, making the price move less reliable.
2. Support and Resistance (S&R) and Volume Analysis
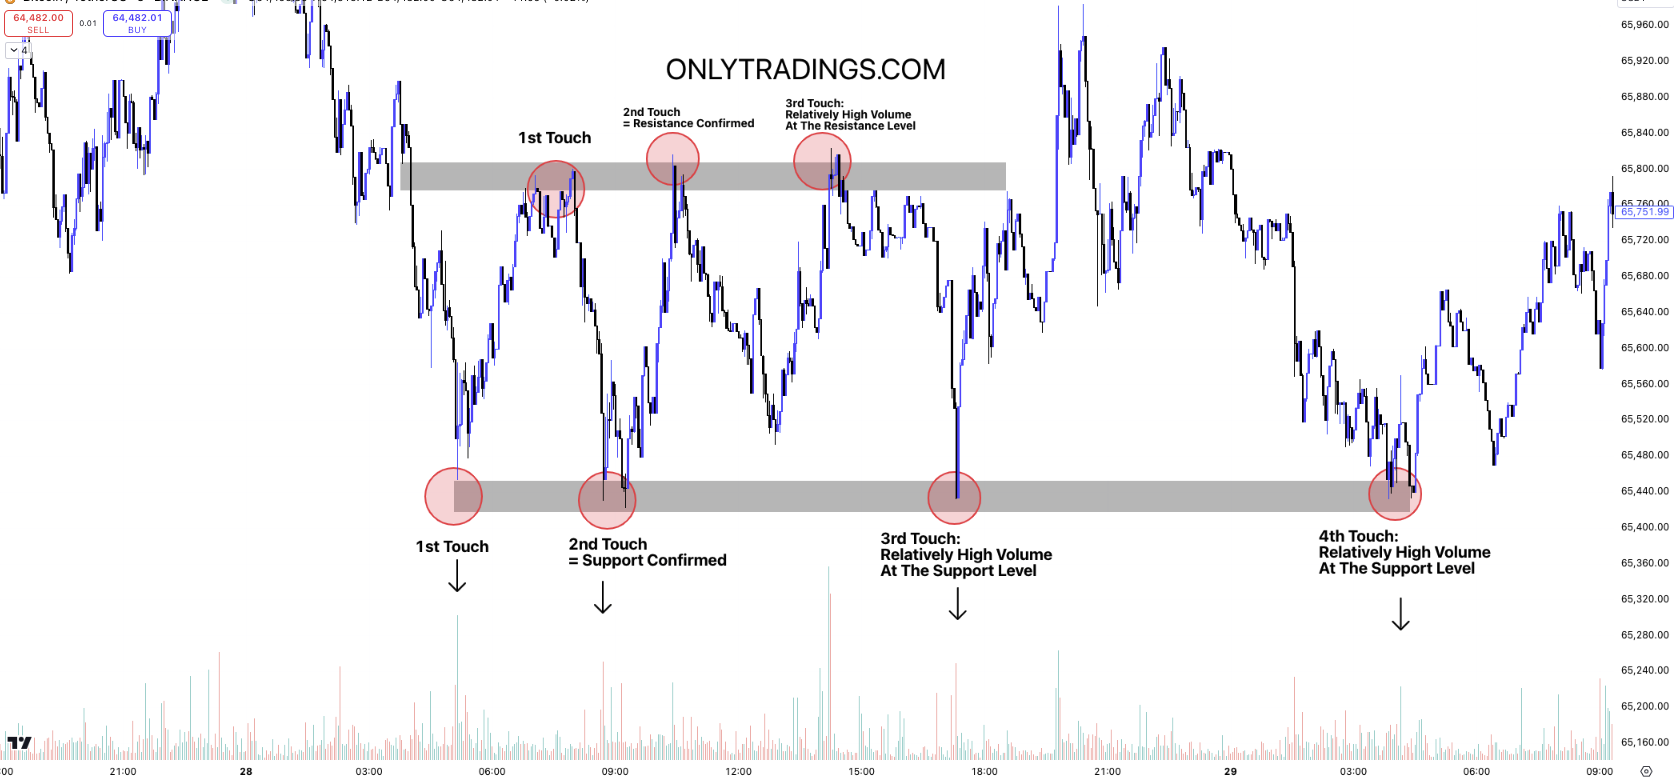
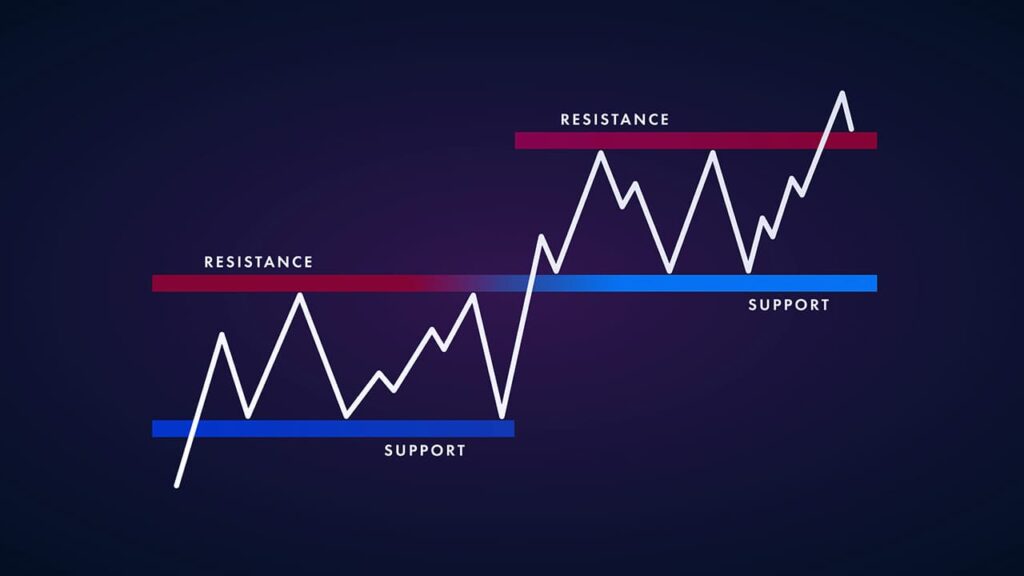
Support and resistance levels are key price points where buying or selling pressure intensifies, causing the price to reverse or pause:
i) Support: Acts as a 'floor,' preventing the price from falling further.
ii) Resistance: Acts as a 'ceiling,' preventing the price from rising further.
By combining volume analysis with S&R levels, traders gain insights into the strength of these price points. Here’s how:
i) High Volume at Support: Indicates strong buying interest, suggesting the support level is likely to hold.
ii) High Volume at Resistance: Shows strong selling interest, making the resistance level more likely to be effective.
Confirming Breakouts with Volume
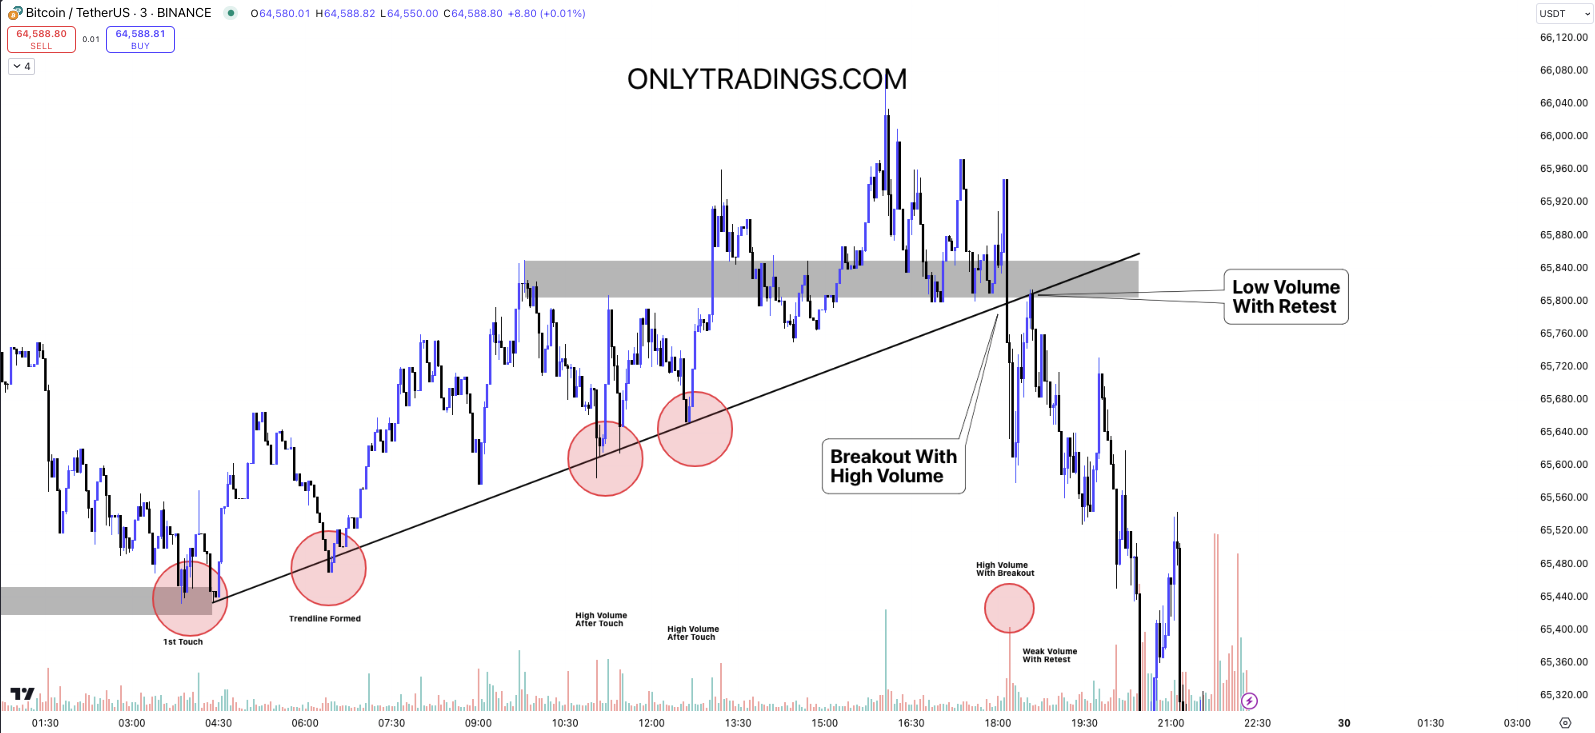
i) High Volume Breakout: A breakout above resistance or below support with a surge in volume indicates genuine interest, increasing the probability of the trend continuation.
ii) Low Volume Breakout: Indicates a lack of conviction, making it more likely to be a false breakout.
iii) Identifying False Breakouts: False breakouts can trap traders, but volume helps differentiate between genuine and false moves. A breakout with low volume is often a warning sign of a potential trap.
3. Trendlines and Volume Analysis
Trendlines represent the overall direction of the market:
i) Uptrend Line: Connects higher lows, acting as support.
ii) Downtrend Line: Connects lower highs, acting as resistance.
Combining volume analysis with trendlines offers insights into the strength and sustainability of the trend:
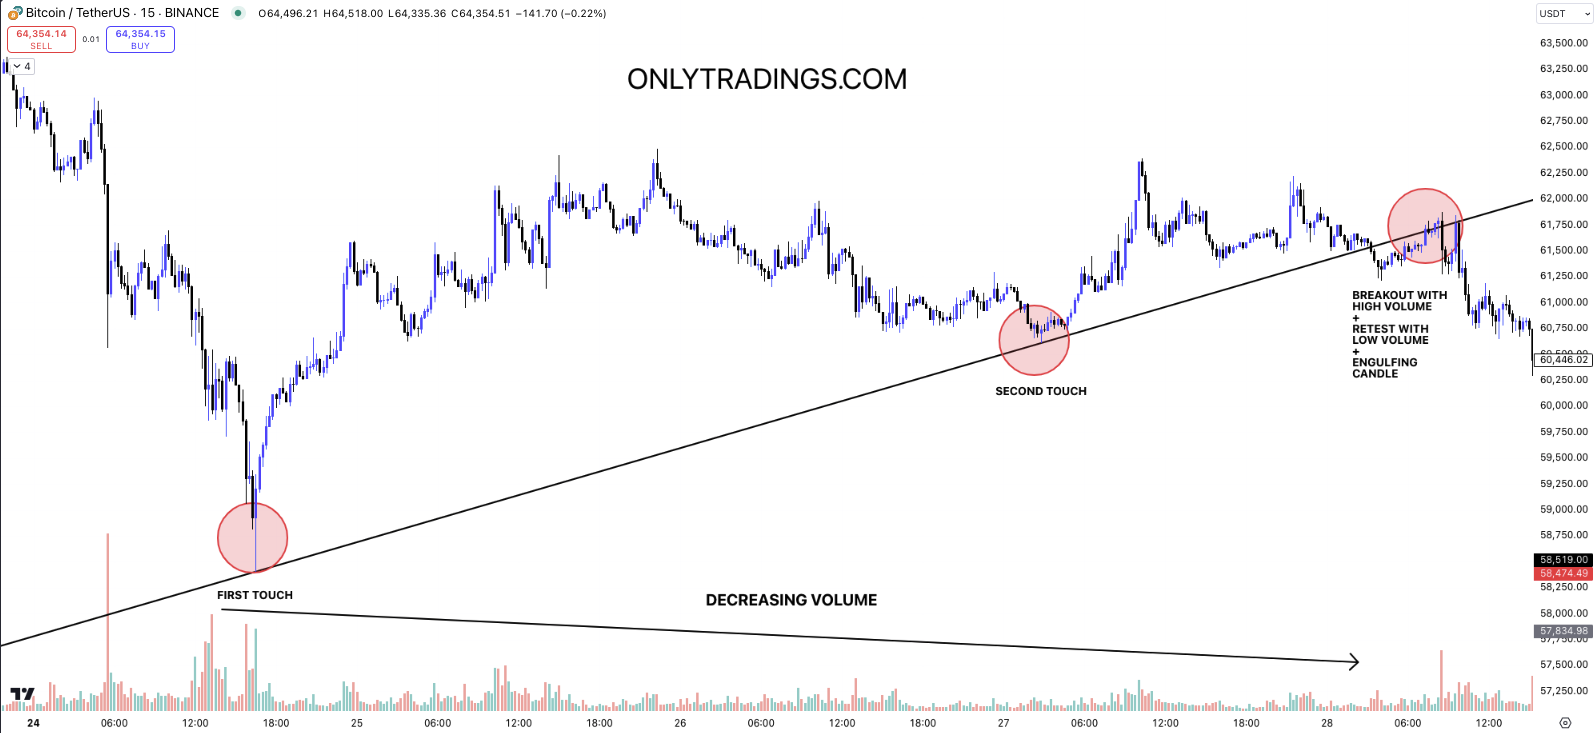
Rising Volume with Trendline: If an uptrend or downtrend is accompanied by increasing volume, the trend is more likely to continue.
Declining Volume with Trendline: Suggests the trend is weakening and could be approaching a reversal.
Validating Breakouts and Breakdowns with Trendlines and Volume
A breakout above a trendline with high volume confirms a potential trend change.
A breakout with low volume signals caution, as it may be a false move.

4. Combining All Elements: Volume, S&R, and Trendlines
When combining all three elements, you gain a comprehensive view of market dynamics. This integration allows for better decision-making by confirming the validity of price movements at key levels:
Support and Resistance: Volume confirms whether these levels are likely to hold or break.
Trendlines: Volume validates the strength and direction of trends.
Breakouts: Volume helps distinguish between genuine and false breakouts at trendlines or S&R levels.
5. Interpreting Volume with Bullish and Bearish Candles
In conventional candlestick analysis, green candles represent bullish movement, while red candles represent bearish movement. Similarly, volume can be color-coded:
Green Volume Bars: Indicate buying activity is dominant.
Red Volume Bars: Show that selling activity is dominant.
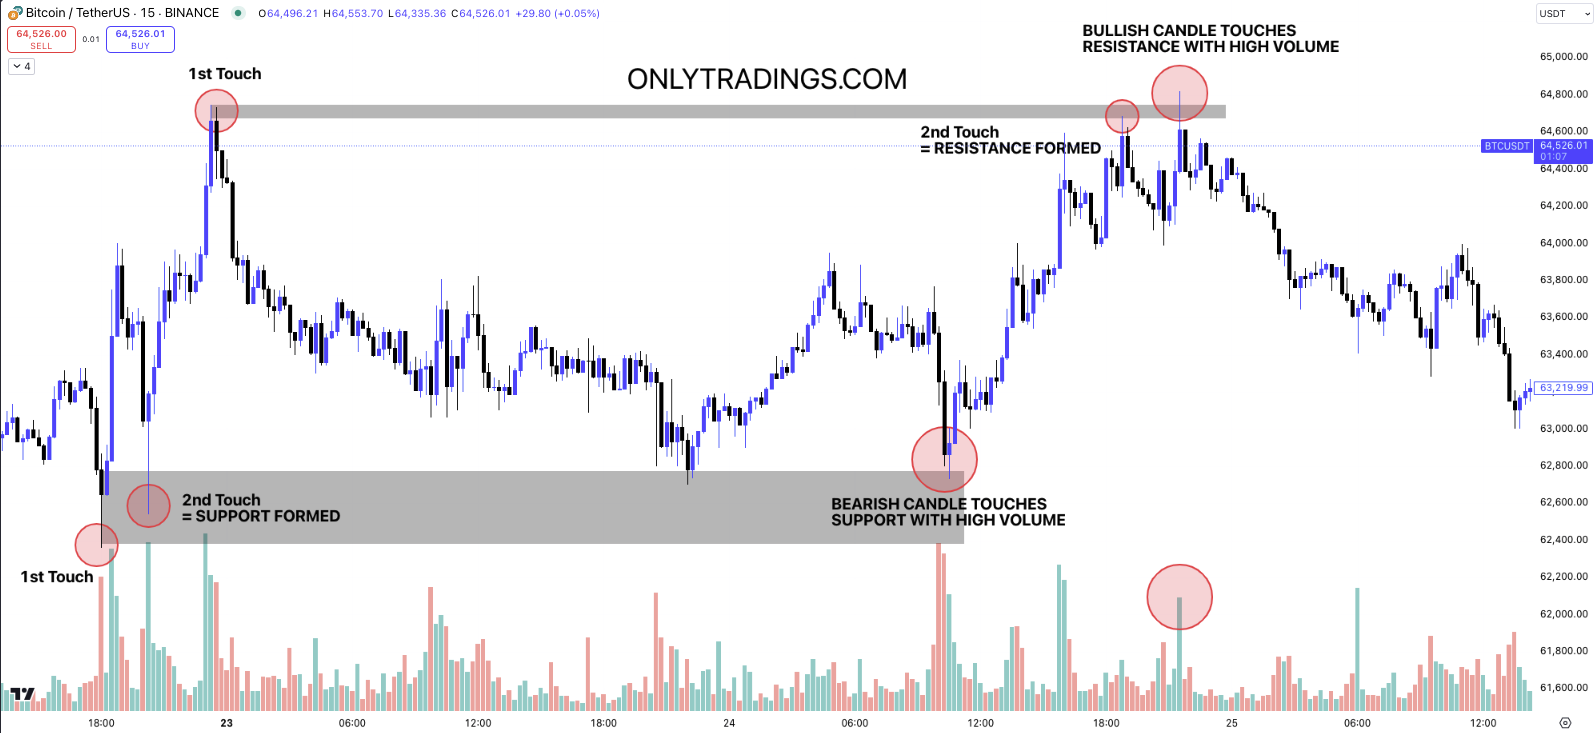
When the price touches a key support level, the initial reaction might be a bearish (red) candle with high volume. This often indicates that sellers are pushing the price downward to test the support level. However, this high red volume doesn't necessarily mean there is only selling pressure. It could also indicate that strong buying interest is emerging at the support level, as buyers step in to absorb the selling pressure.
Example Analysis: Red Volume and Buying Pressure at Key Zones
Suppose the price touches a support zone, and a bearish candle appears with high red volume. Even though it's a red candle, this high volume suggests significant activity at this level. Here's how to interpret it:
Increasing Buying Pressure:
The high volume means there's a battle between buyers and sellers at the support level. The fact that the volume spikes as the price touches support indicates that buyers are actively purchasing the asset, despite the initial selling pressure. This can signal a potential reversal or bounce from the support level.
In this scenario, it’s essential to wait for confirmation, such as a bullish (green) candle with rising volume to indicate that buyers have gained control.
6. Practical Strategy: Applying These Concepts in Trading
i) Identify Key Zones: Draw S&R levels and trendlines to mark significant price zones.
ii) Monitor Volume: Watch how volume behaves as the price approaches these key zones.
iii) Look for Confirmation: Enter trades when volume confirms price action, such as high volume breakouts or reversals at trendlines or S&R levels.
iv) Manage Risk: Use stop-loss orders just below support or above resistance to protect against false breakouts.
Conclusion
By combining volume analysis with support and resistance levels and trendlines, traders can significantly improve their decision-making process. Volume serves as a confirmation tool, validating the strength of trends, breakouts, and reversals. When bullish and bearish candles interact with key zones, the accompanying volume provides valuable insights into whether the move is genuine or likely to reverse.
Pro Tip: Always use volume analysis in conjunction with other technical indicators to further increase your trading accuracy and probability of success. This comprehensive approach can enhance your ability to identify high-probability trade setups and manage risks more effectively in your trading journey.

© 2024 onlytradings.com. All rights reserved. The information in this publication is for general informational purposes only and does not constitute professional advice. onlytradings.com assumes no responsibility for errors, omissions, or outcomes related to the use of this information. We maintain a neutral stance on all political matters, providing unbiased content that should not be interpreted as an endorsement of any political party, candidate, or policy. No part of this publication may be reproduced or transmitted without prior written permission. For inquiries, visit www.onlytradings.com.


