BTC/USDT Analysis: Key Trendline Test on October 21, 2024


BTC/USDT UPDATE


Instrument: BTC/USDT

Time Frame: 1H

Exchange: PHEMEX

Trading Type: Day&Swing-Trading


81a53-671628cc5cd64-b3f6b052093a1007e77b9fbfb94c33d815957e9f.png


Monday, October 21, 2024

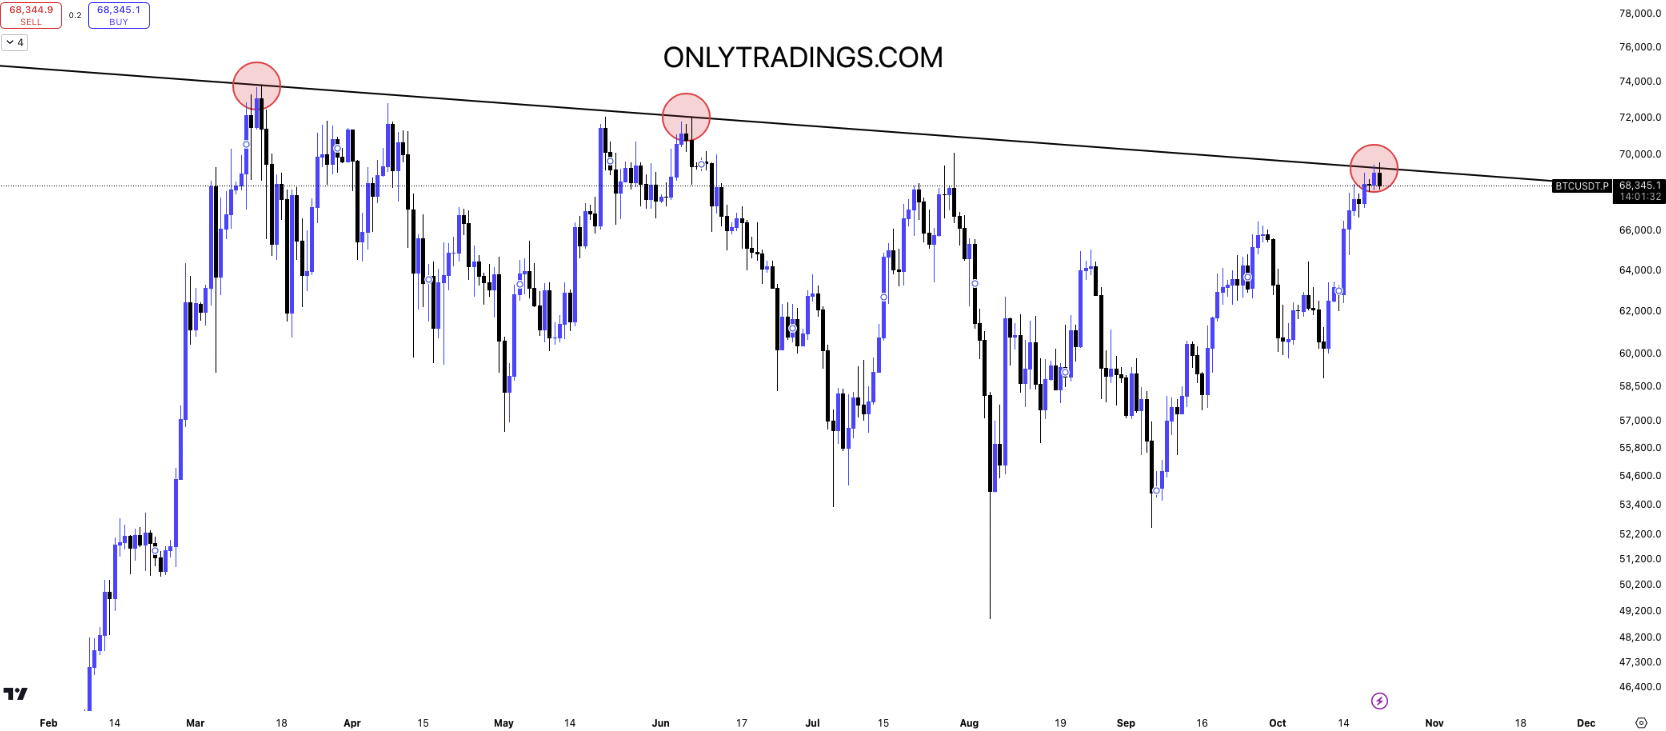
Today could be a very important day. Let's take a look at whether Bitcoin can break through the current trendline or not.

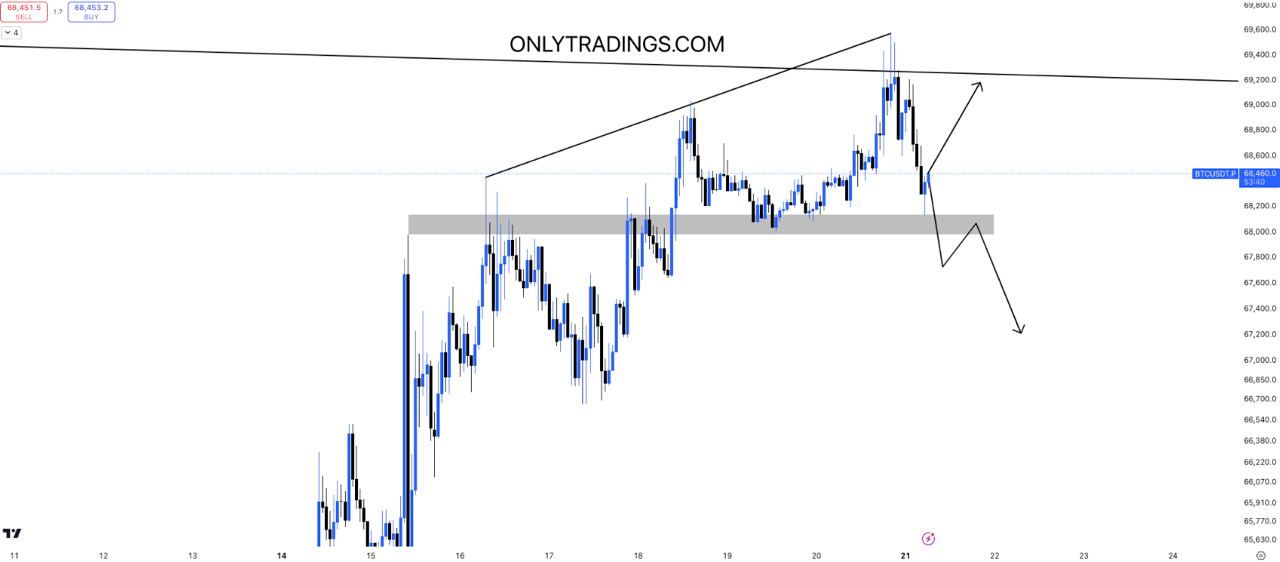
Looking at the 1-hour chart, we can see that Bitcoin faced resistance at the upper trendline, and it’s a bit disappointing that the candlestick couldn't close above this trendline.


81a53-671628e23c25c-ef12e8ed624c1389985d90efbec46bff5b38eec5.jpg


Honestly, today's price action is a bit unclear, with the upward trendline also looking somewhat unusual. There's not much else to say for now. However, if Bitcoin breaks below the $68,000 level (the gray box) and successfully retests it, we might start monitoring the market from a bearish perspective and respond accordingly.