Critical Breakout or Reversal? Bitcoin's Next Move Hinges on Key Resistance Levels
Instrument: BTC/USDT
Time Frame: 1 Hour + 5 Minutes
Exchange: OKX
Trading Type: Day-Trading

Good Monday morning!
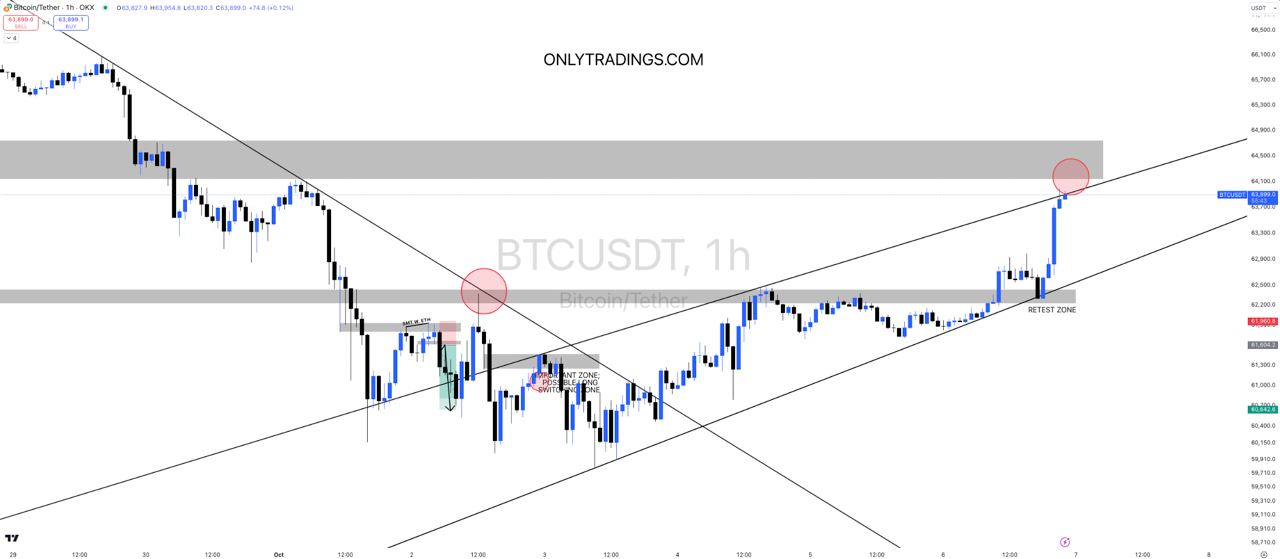
As noted in the tagged post, we can see that most of the key levels I mentioned are being retested and showing upward movement.
After breaking through and retesting the RETEST ZONE, we are seeing a sharp rise, but I believe the next major resistance zone will be around $64,100 - $64,800.
If Bitcoin fails to break this level, it may stagnate again, but if it breaks through, we could see another potential rally.
Looking at the red circle on the right, you’ll notice that the critical zone intersects with the ascending trendline.
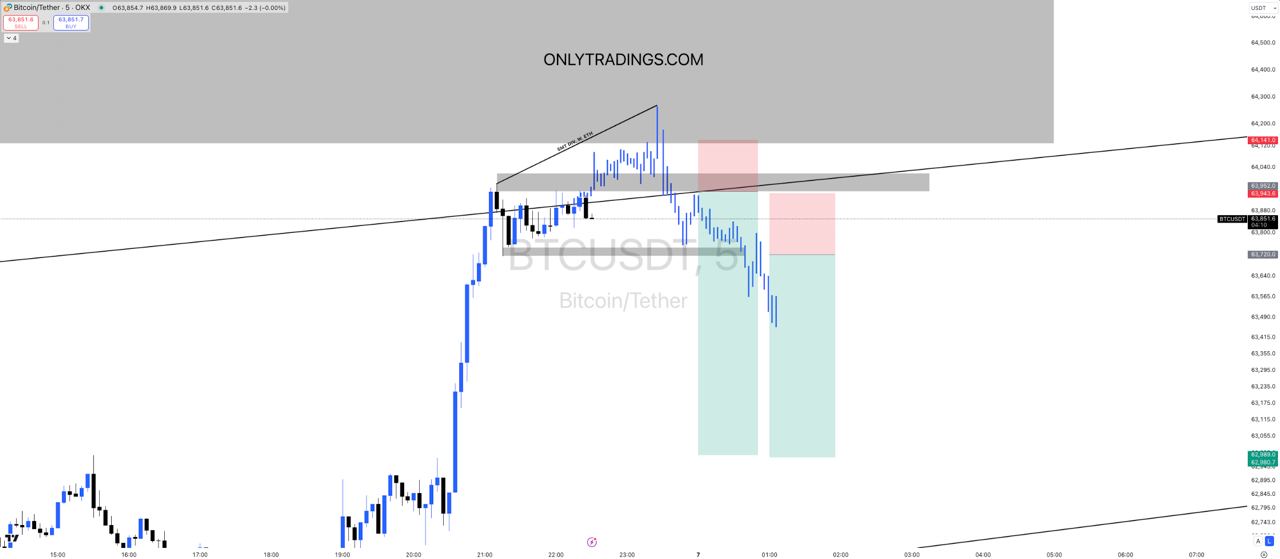
So, I’m keeping a close watch on Bitcoin from now, and if I take a short position, it will be based on the following conditions to ensure I’m confident before entering a trade.
Premise: Bitcoin must reach/touch the upper gray zone.
#1. Is there an SMT divergence?
#2. Does the 15-minute/5-minute chart show a structural shift and break down a key level, followed by a retest (the retest area will be the entry point)?
#3. Is there also an RSI divergence?

These are the scenarios I’m watching.
If this setup forms, either of the two places could present a good shorting opportunity.

