
What is OI?
Open Interest (OI) represents the total number of outstanding contracts (futures or options) that have not yet been settled. In simpler terms, it indicates how many active positions are currently open in the market.
- Rising OI: Indicates increased market participation and new capital entering the market.
- Declining OI: Suggests positions are being closed or reduced trading activity.
While OI alone does not predict price direction, combining it with price action provides valuable insights:
- Rising price + increasing OI → Bullish (buying strength)
- Rising price + declining OI → Short covering
- Falling price + increasing OI → Bearish (selling strength)
- Falling price + declining OI → Long liquidation
Real-Time Application of OI: Ethereum Case Study
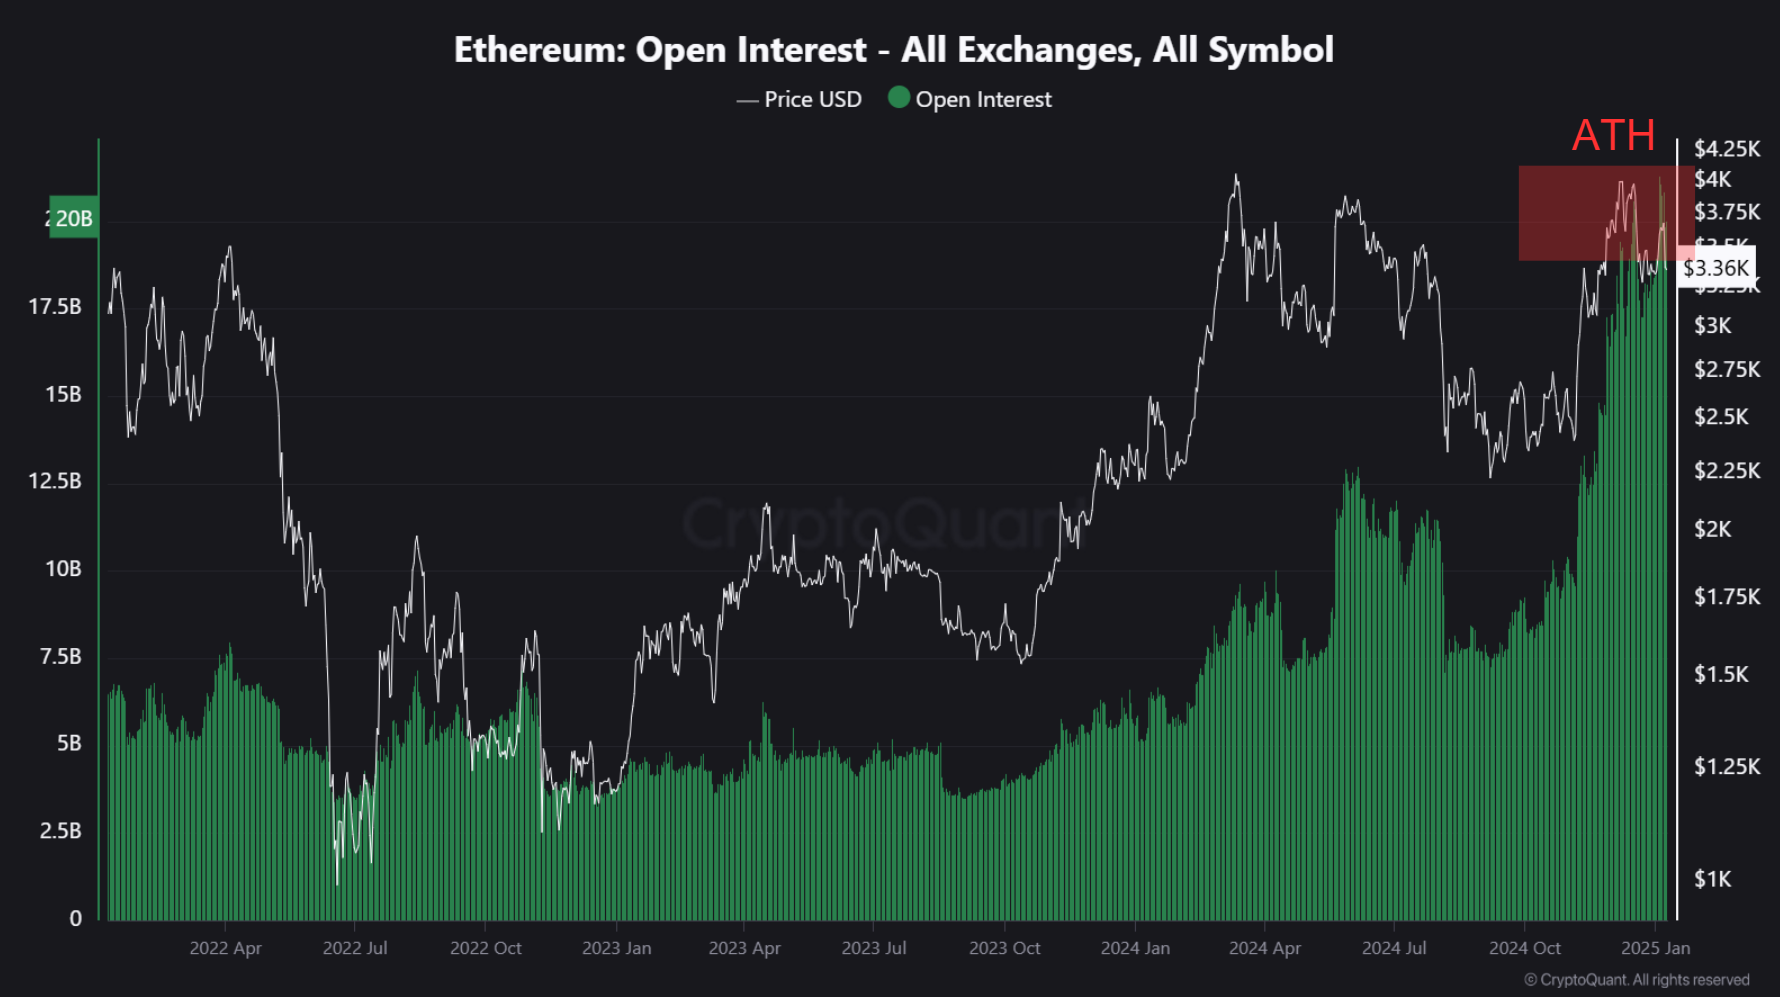
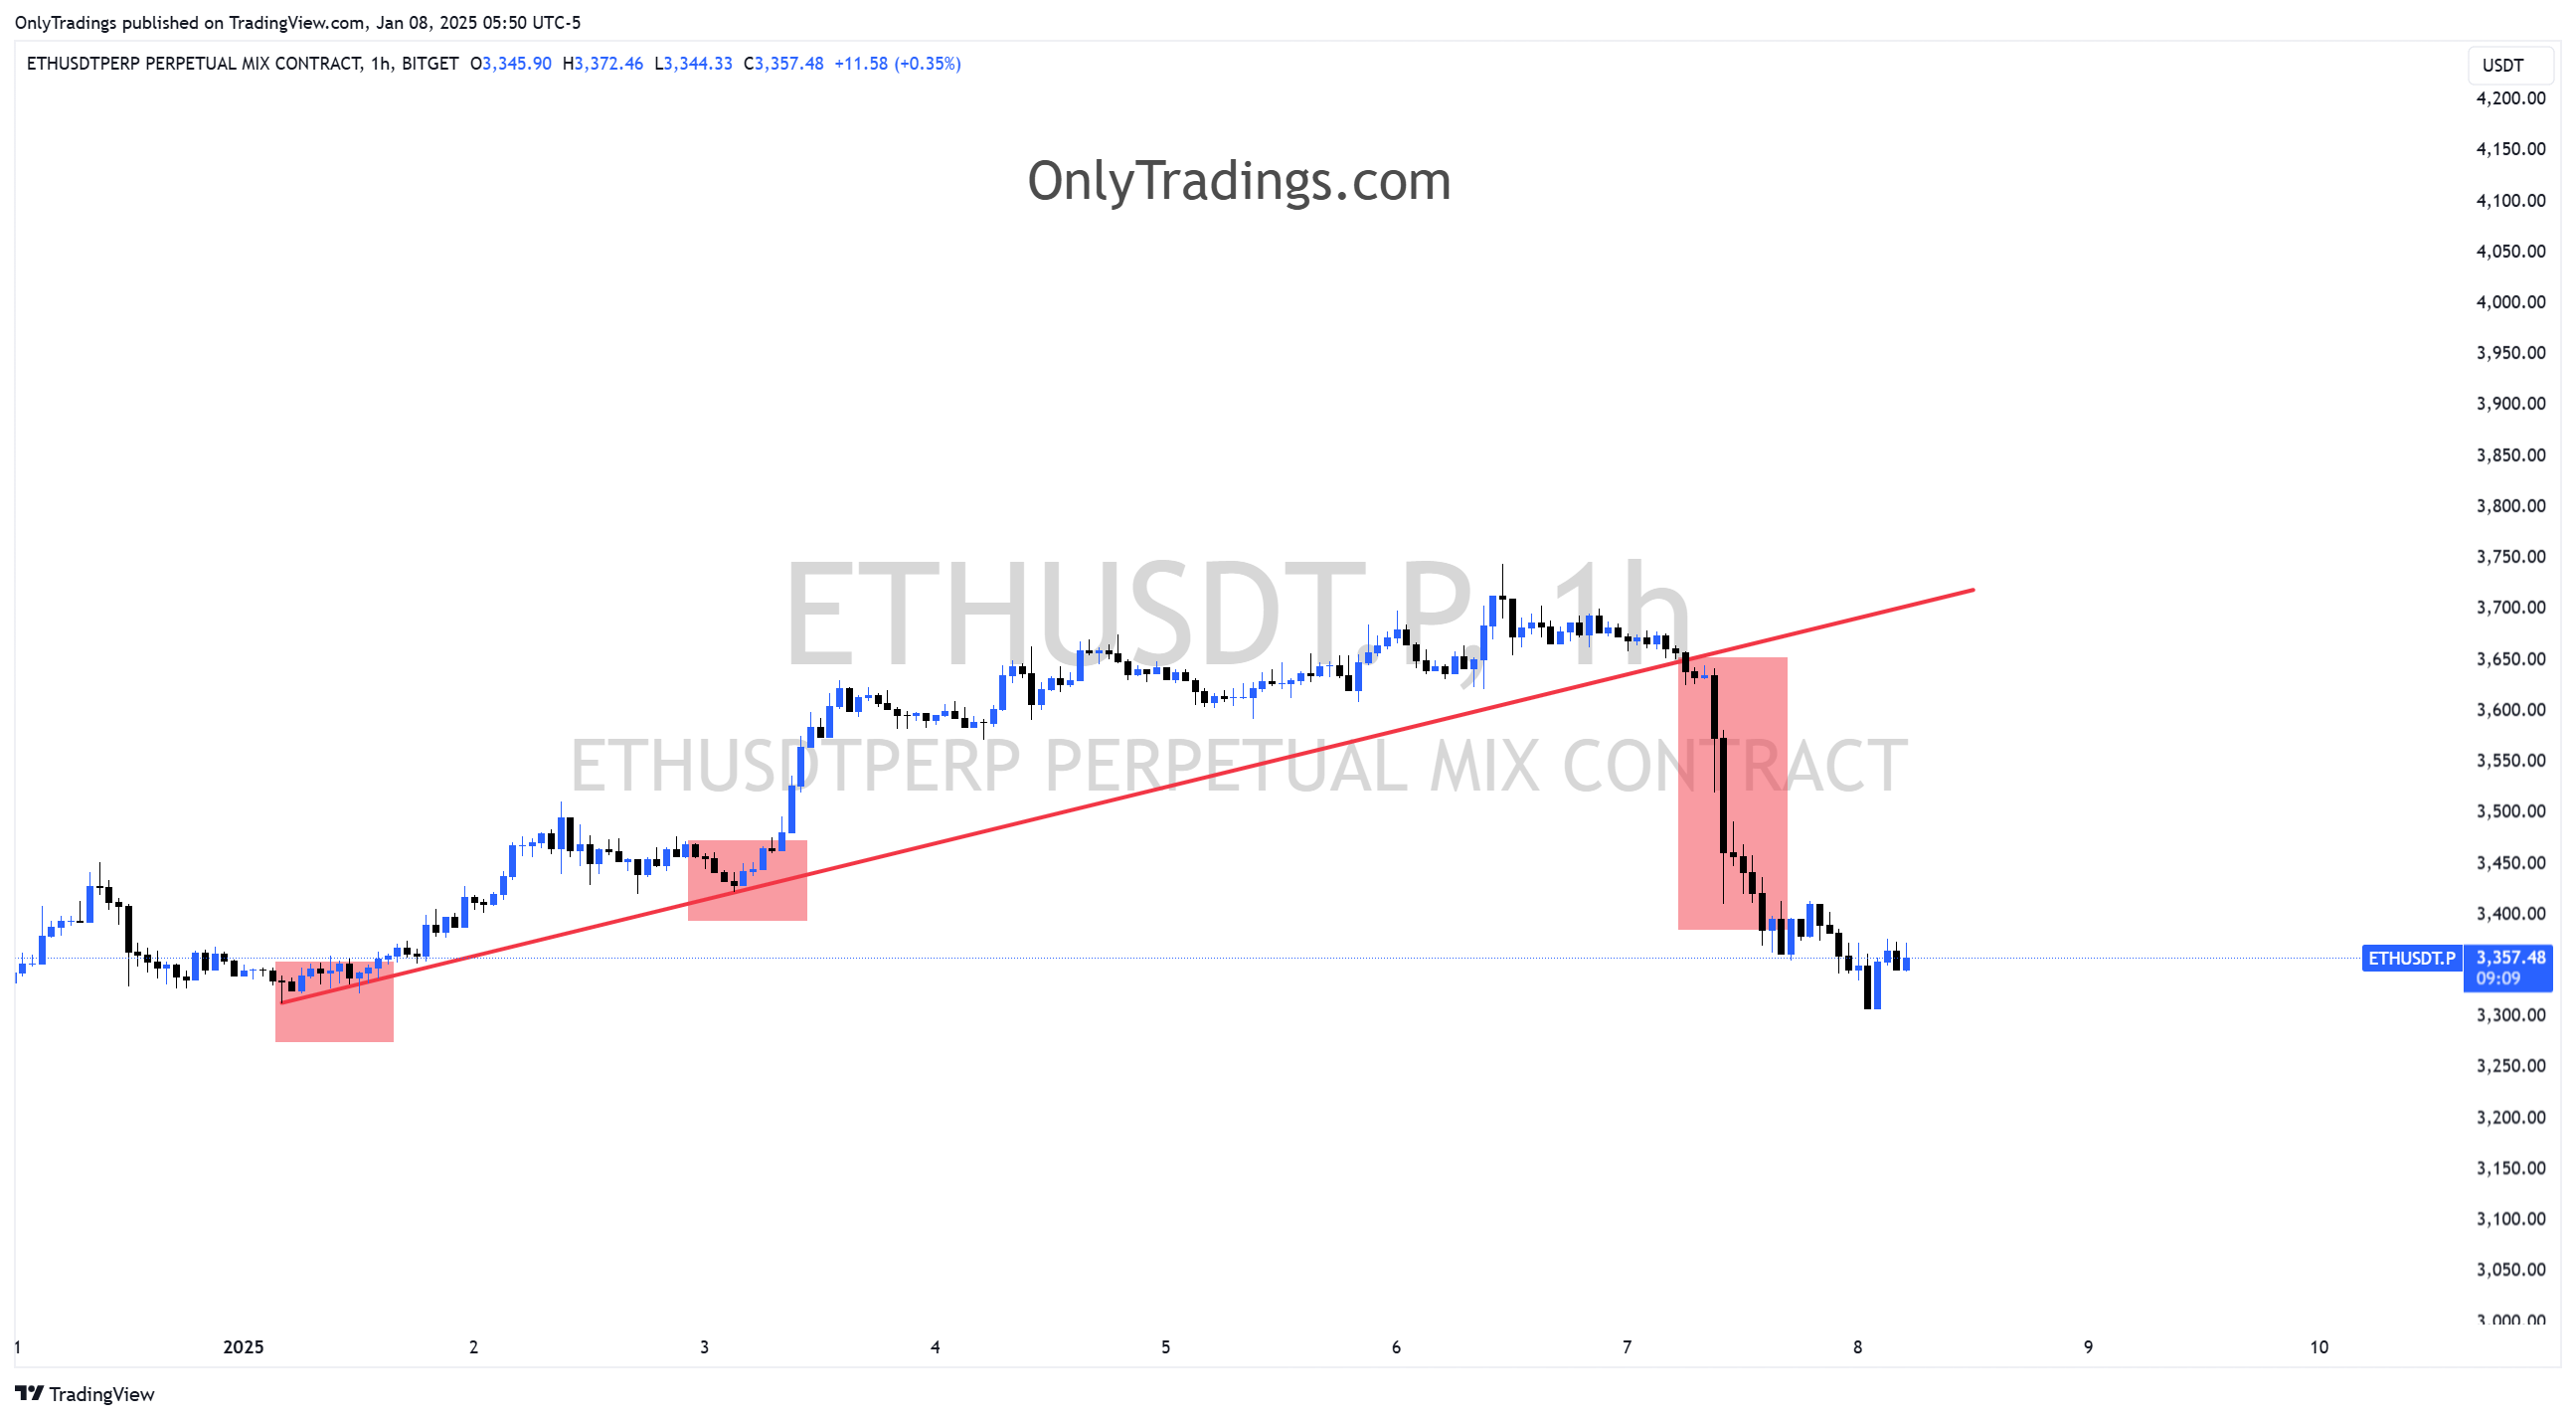
Last night, Ethereum’s OI chart hit an all-time high (ATH), signaling extreme market activity. Historically, ATH levels in OI are often followed by significant market volatility. Last night’s events confirmed this pattern.
-
Scenario Analysis:
- Ethereum’s OI reached ATH, indicating both heavy long and short positions in the market.
- Prices initially consolidated, but signs of an overheated market structure became apparent.
- A sharp drop followed, triggered by mass liquidation events (short squeezes and long liquidations).
-
Outcome: Ethereum’s price broke critical support levels amidst high volatility. Traders who leveraged OI data for preemptive strategies were able to capitalize on this movement effectively.
OI Analysis of Key Pairs
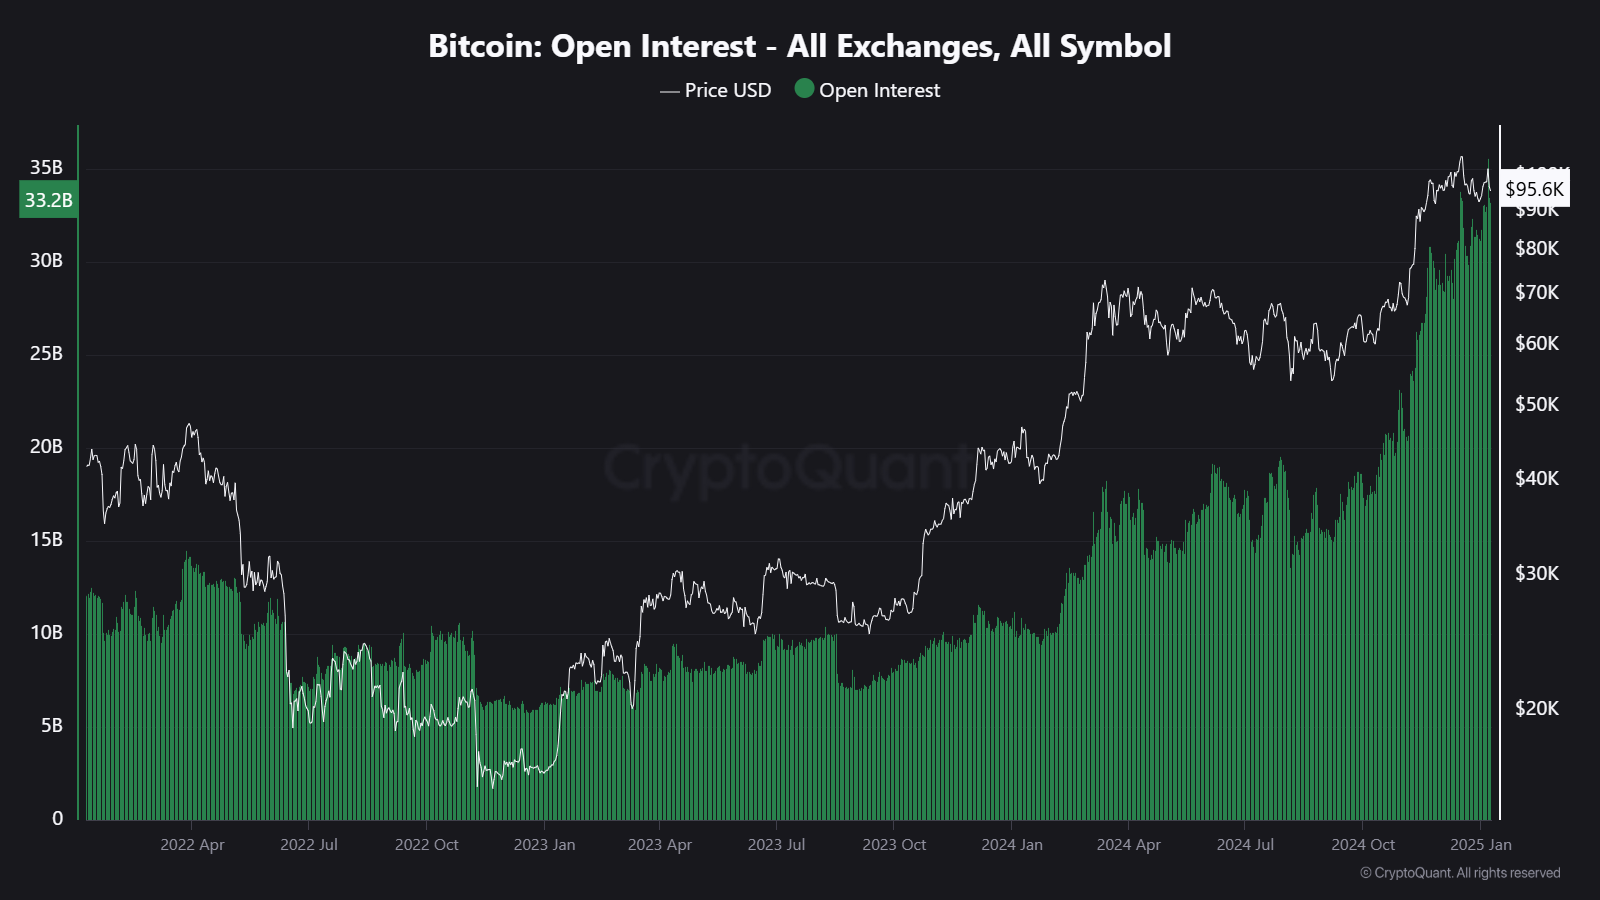
Bitcoin (BTC):
- OI is steadily rising, indicating an ongoing buildup of market positions.
- Combined with technical indicators, significant price movement is anticipated.
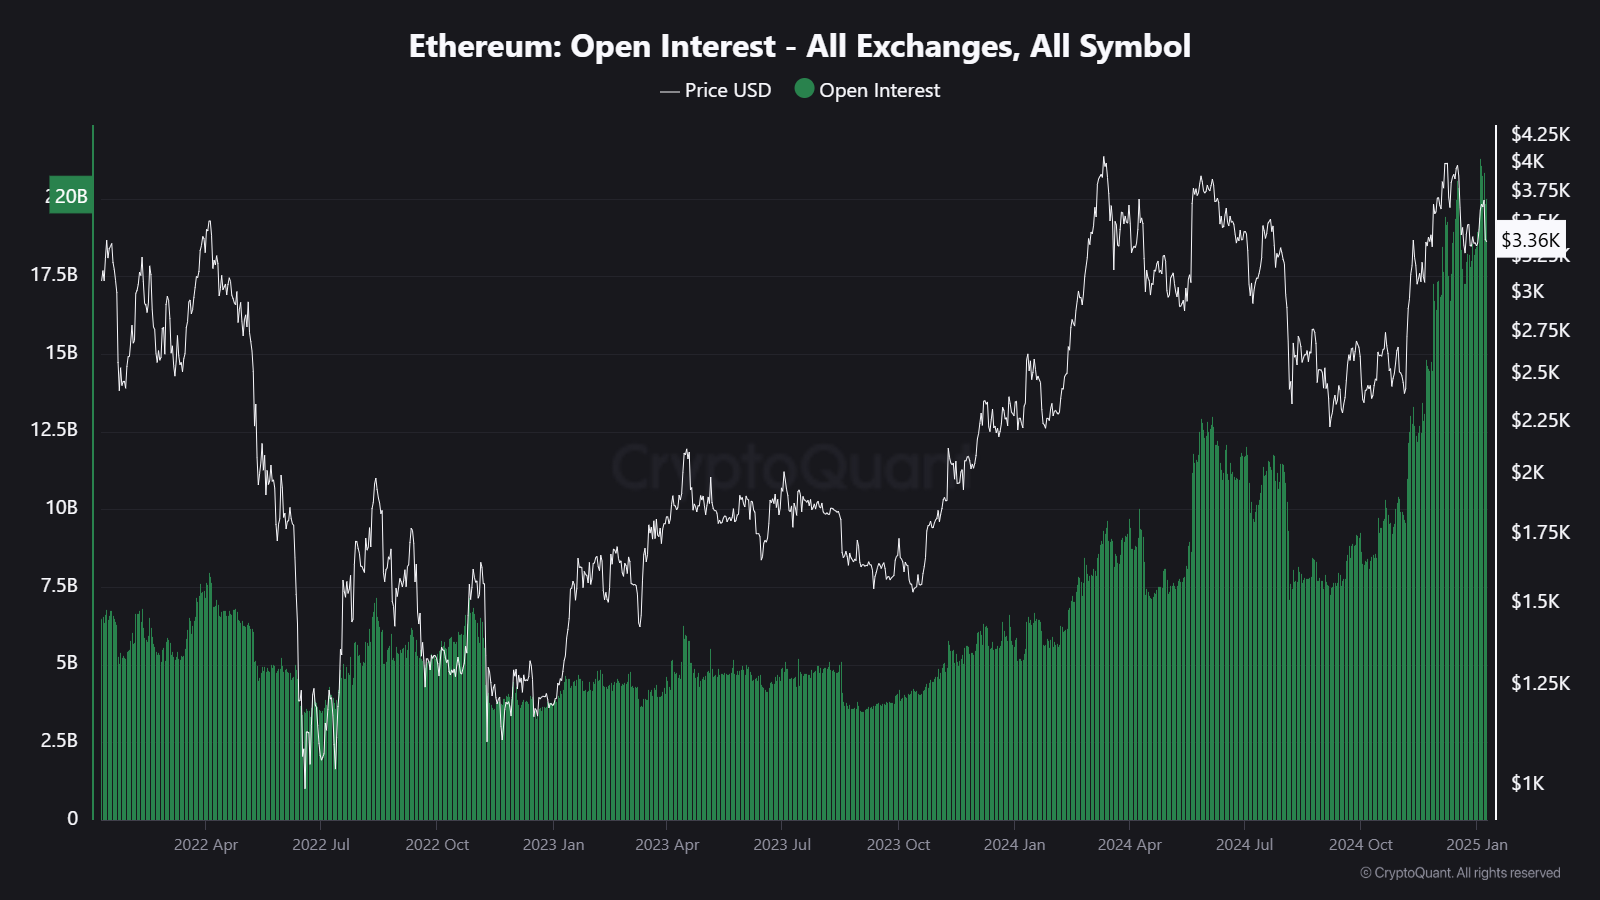
Ethereum (ETH):
- OI dropped sharply after reaching ATH, reflecting mass position liquidation.
- Short-term stabilization is expected, but further volatility cannot be ruled out.
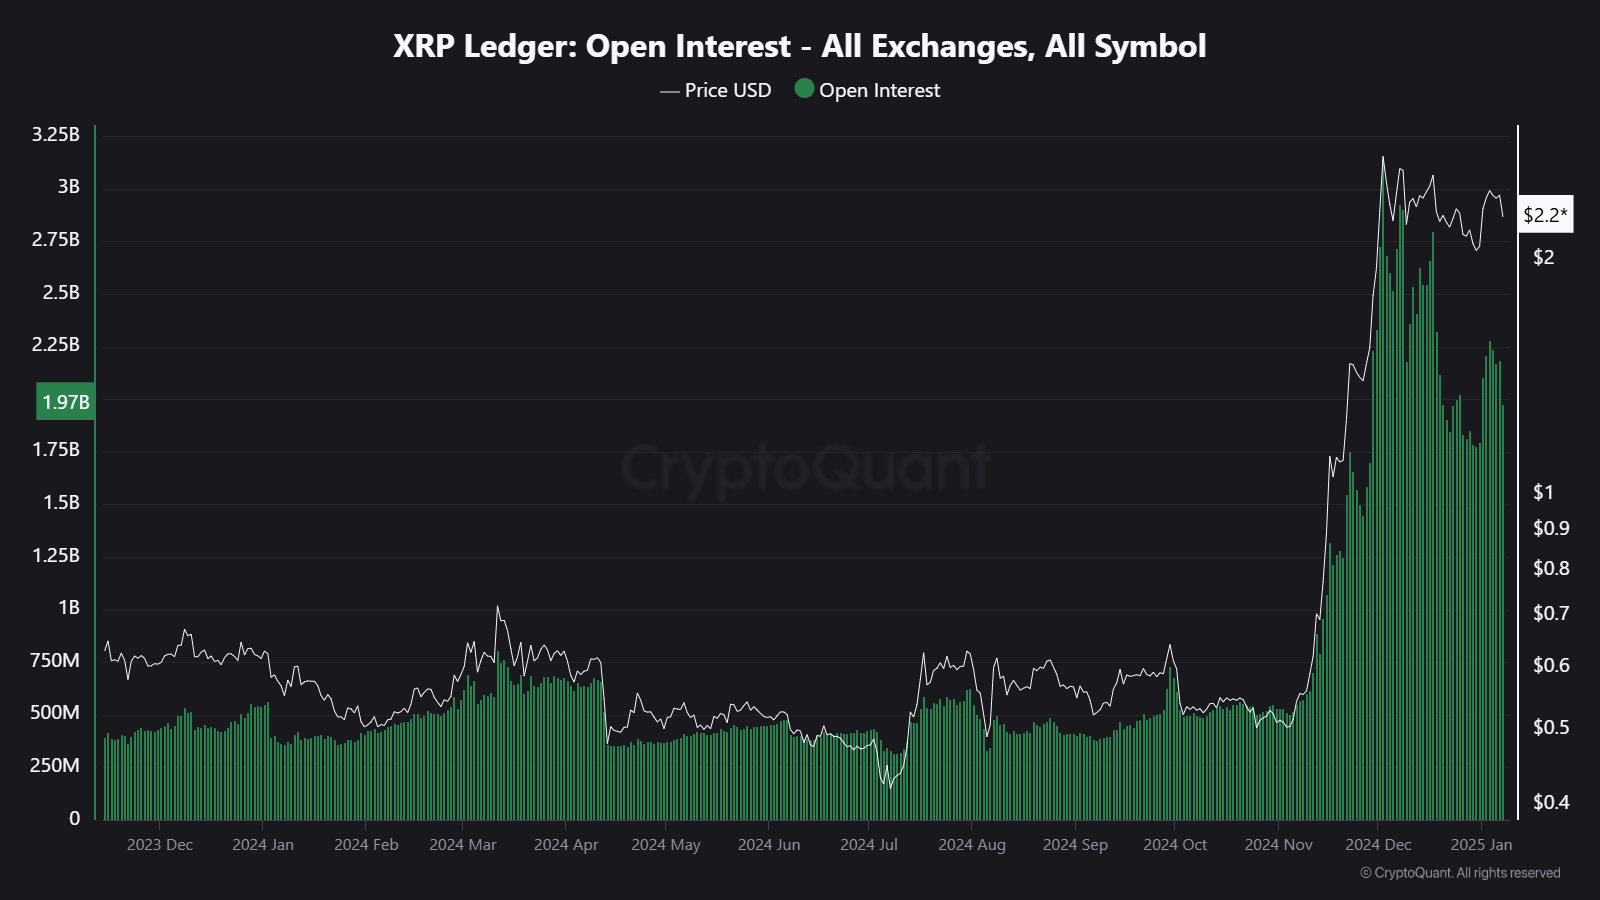
Ripple (XRP):
- OI is moderately rising as XRP tests its support levels.
- Given XRP’s sensitivity to news, monitoring OI alongside price movements is essential.
Conclusion & Strategy
OI serves as a critical indicator of market sentiment and is particularly useful during periods of high volatility. Ethereum’s case study highlights the importance of real-time analysis and the strategic advantages of monitoring OI. By correlating OI with price and volume, traders can make informed decisions and enhance their trading strategies.