Instrument: BTCUSDT
Time Frame: 1 week
Exchange: Bitget
Trading Type: Swing Trading

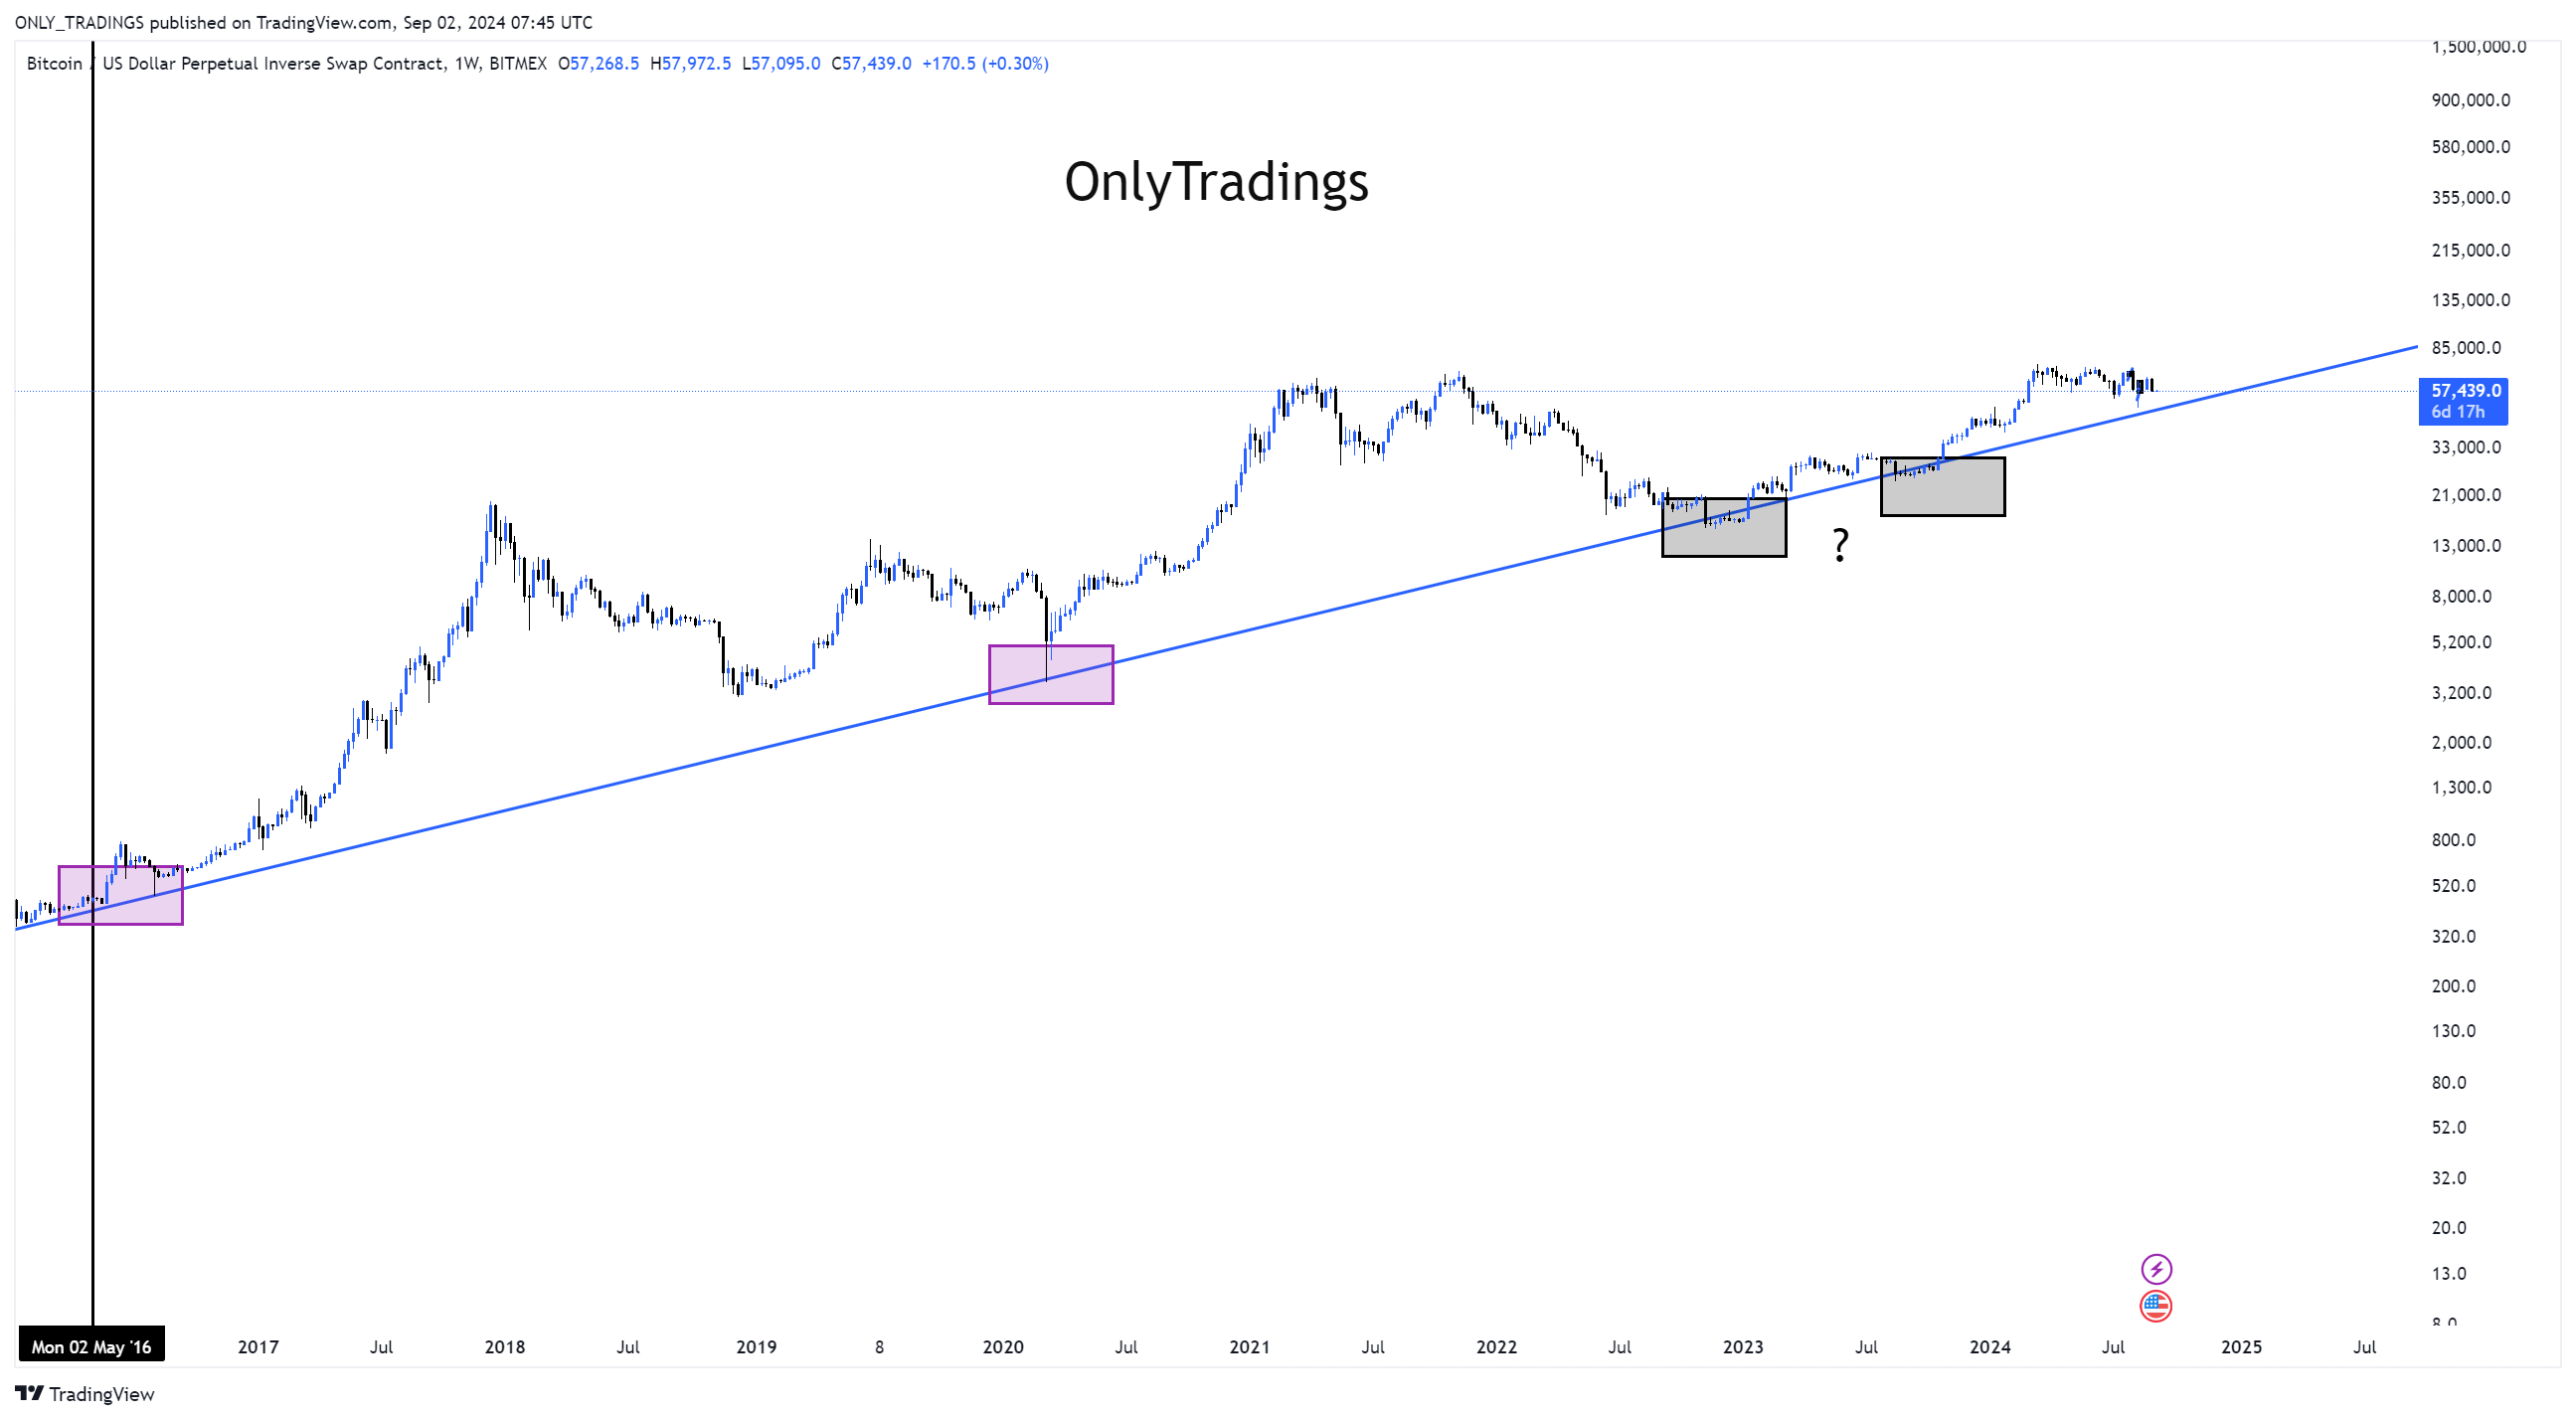
The BTC logarithmic chart is one of the most effective settings for identifying long-term trends.
When examining the trend that has continued since 2016 through the log chart, one peculiar observation can be made. If you look at the area where the trend was supported in 2022 and 2023 (black box), you can see that it briefly dipped below the trend before bouncing back. Do you know what this situation implies?

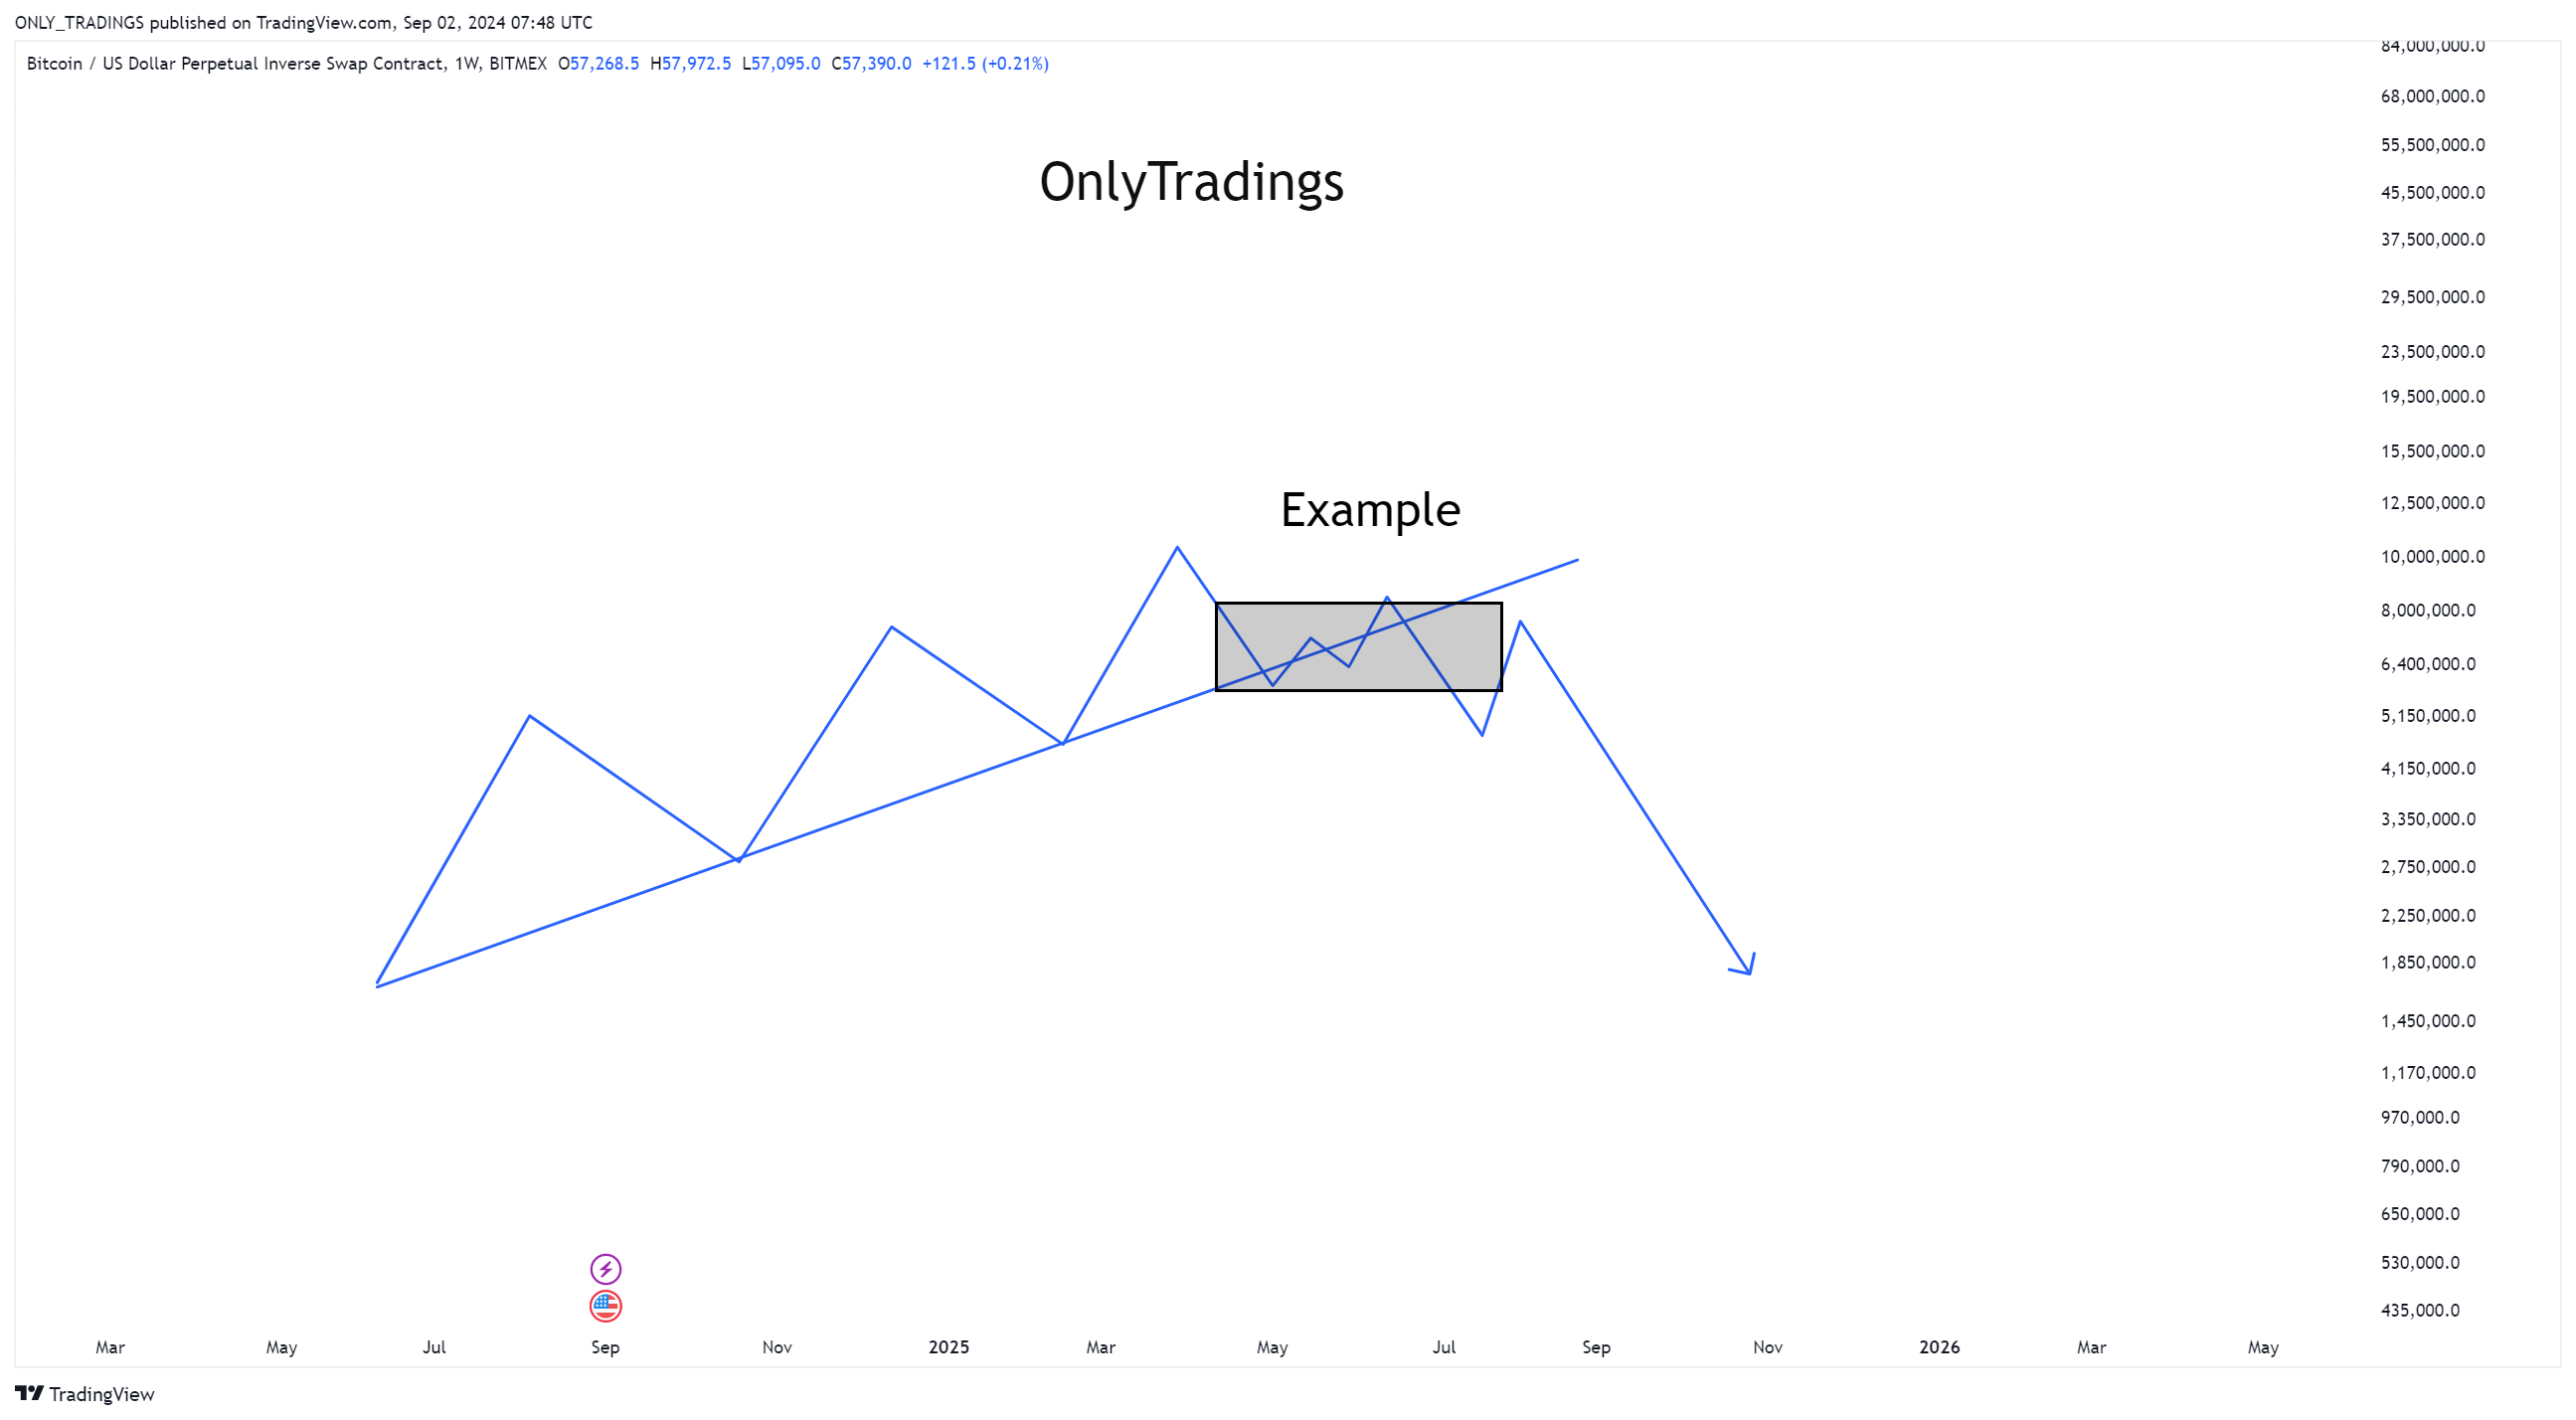
Usually, when a trend is barely holding on like this, it suggests that we should question whether the trend is weakening.
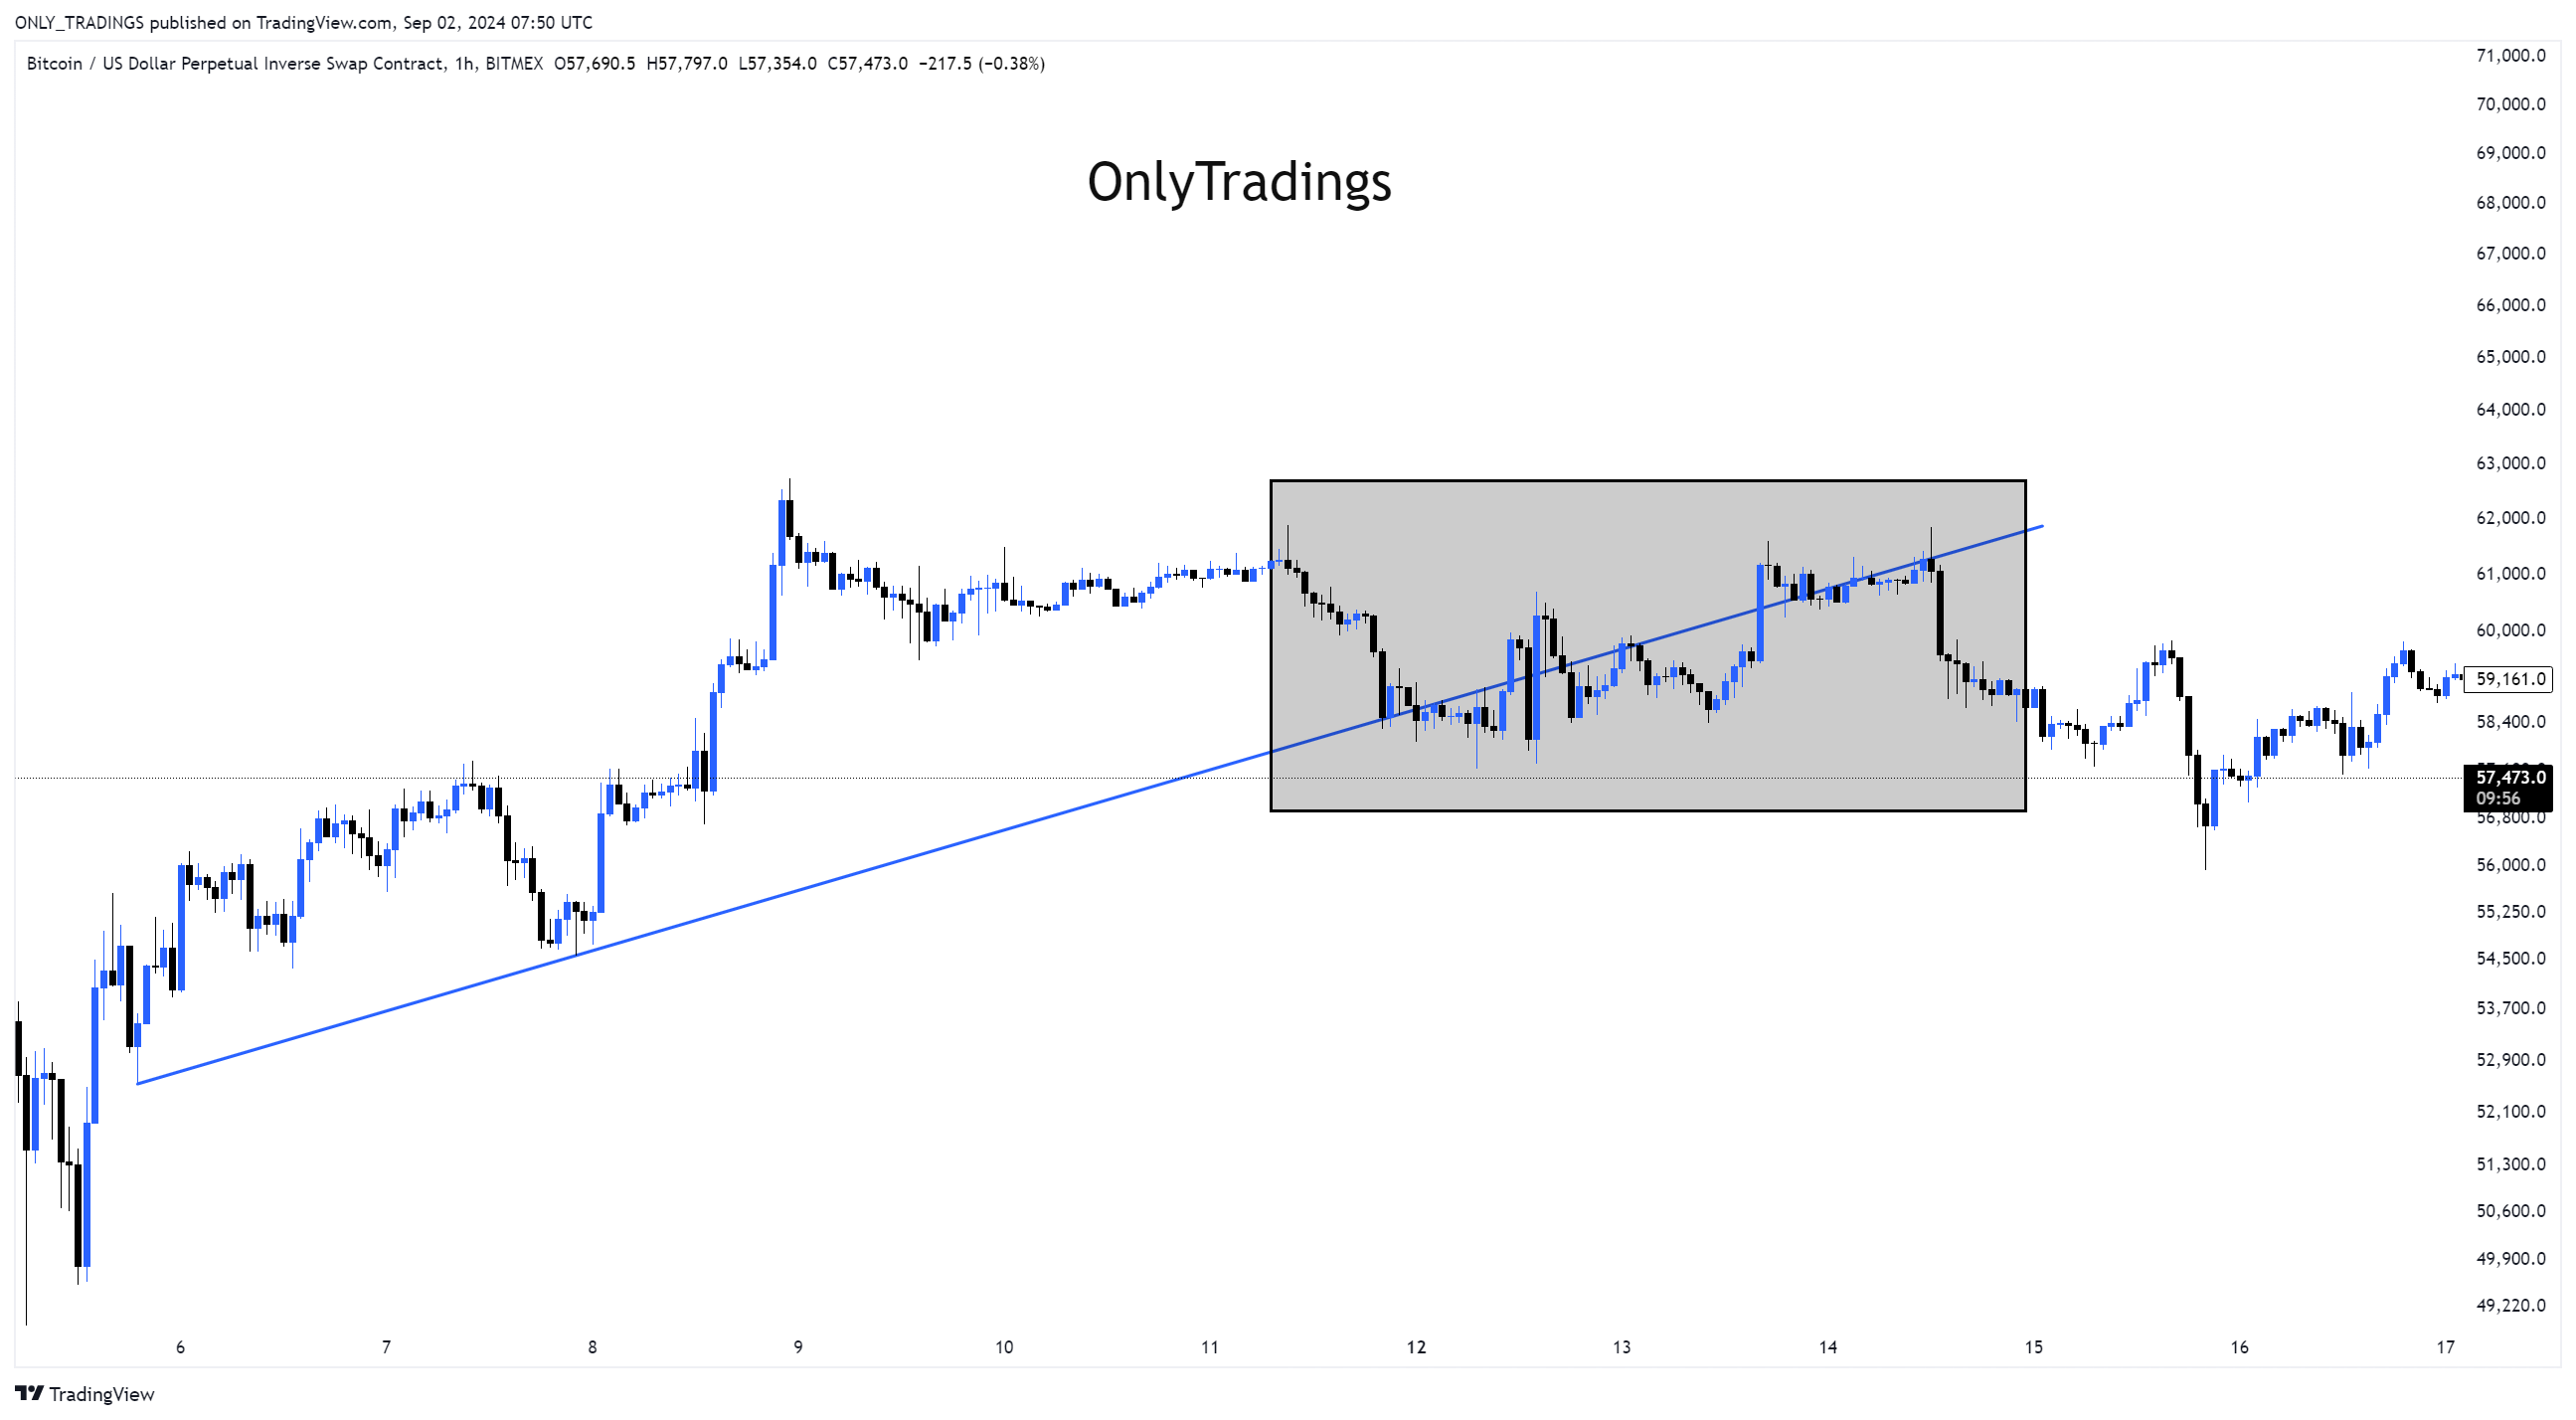
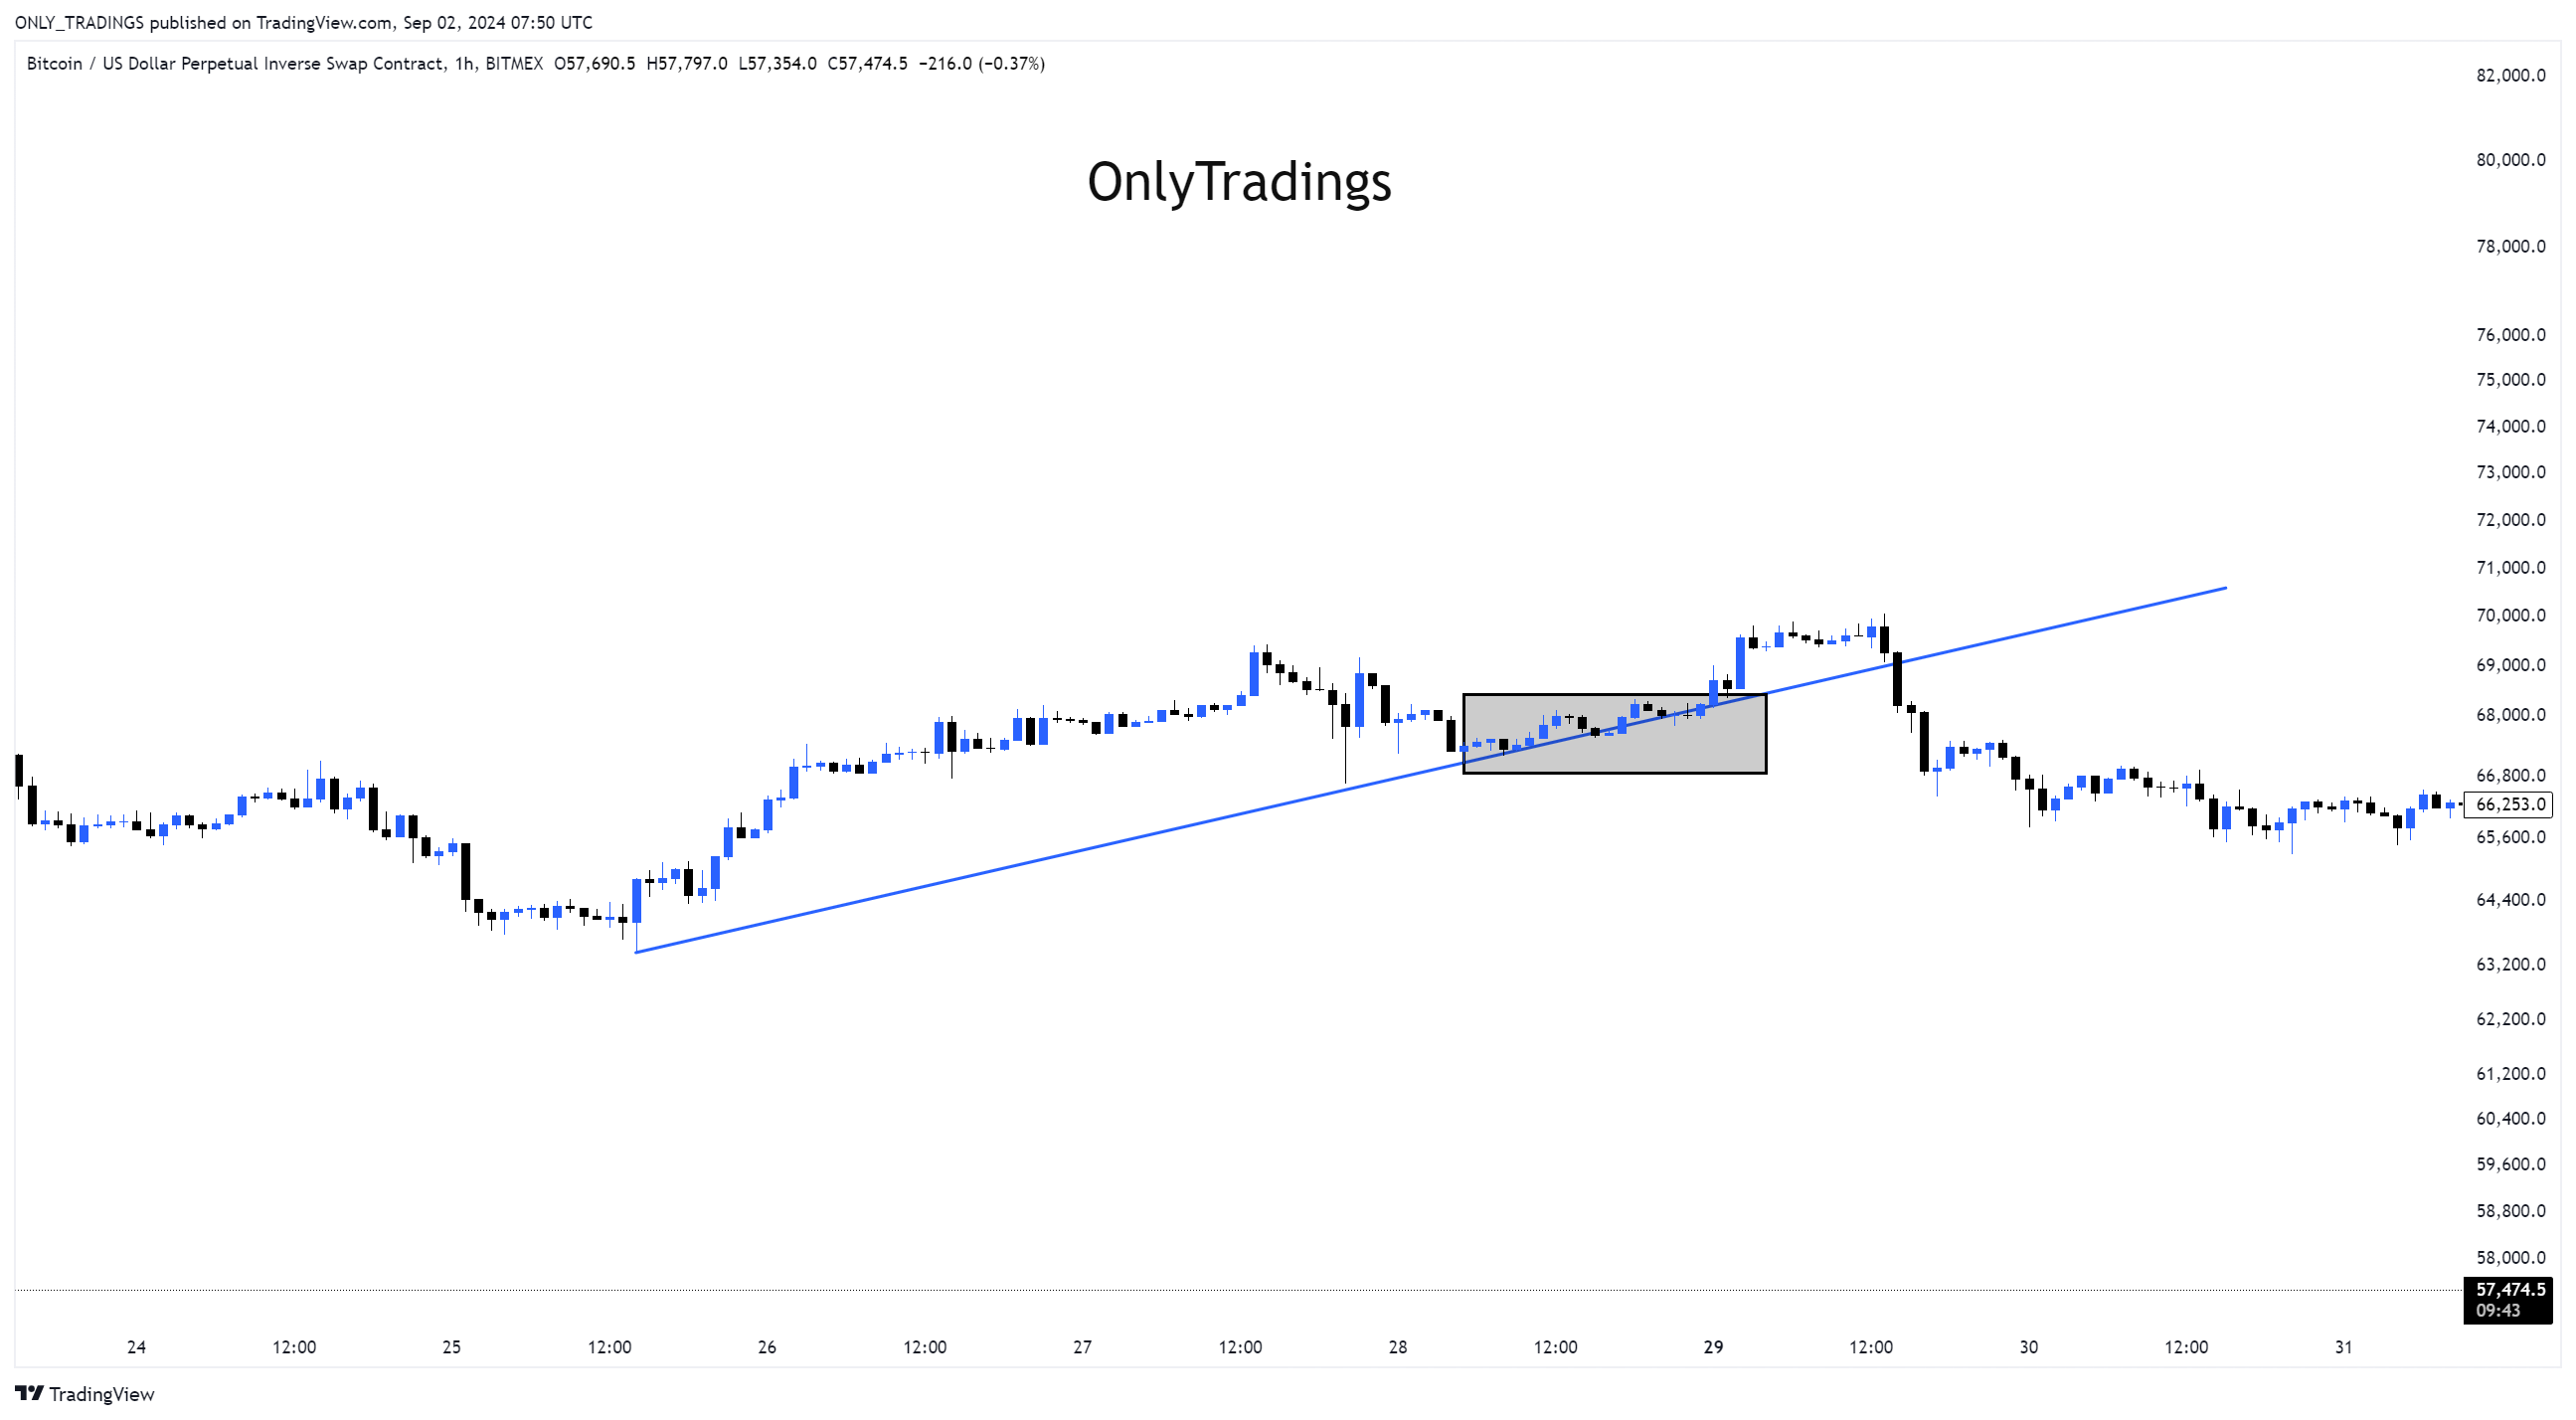
Here are a few examples to illustrate this. When using trendlines for support and resistance trading, it's essential to pay attention to these details.


