Instrument: SOLUSDT
Time Frame: 4 hour
Exchange: Bitget
Trading Type: Swing Trading

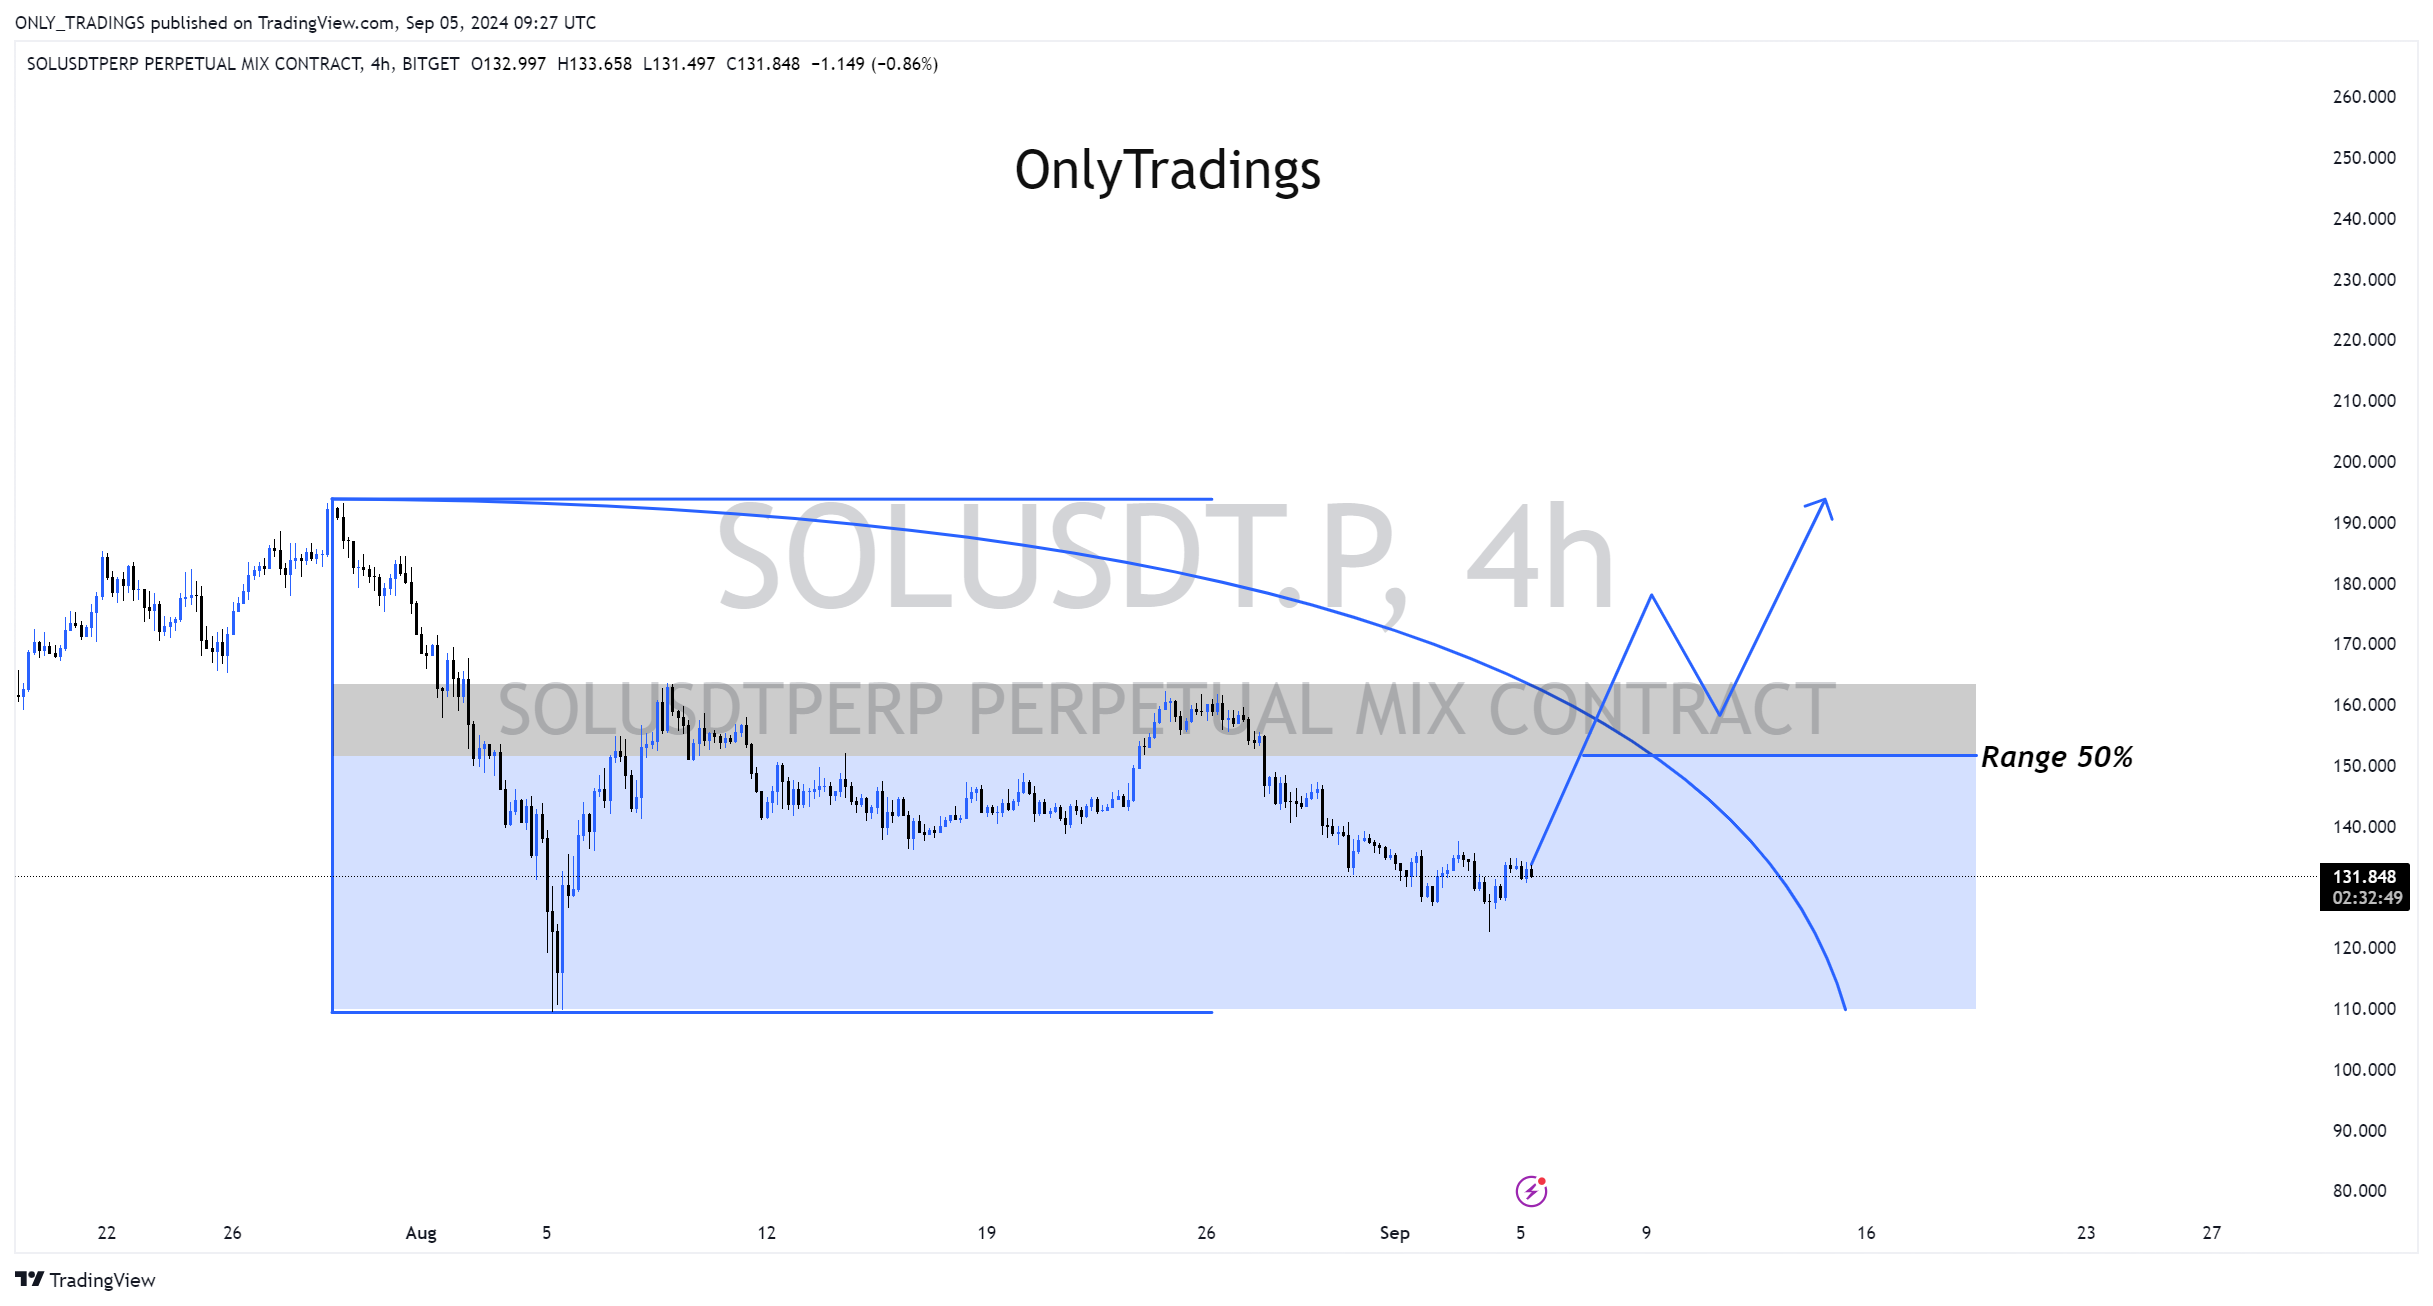
I have set the 4-hour chart for Solana as the main time frame.
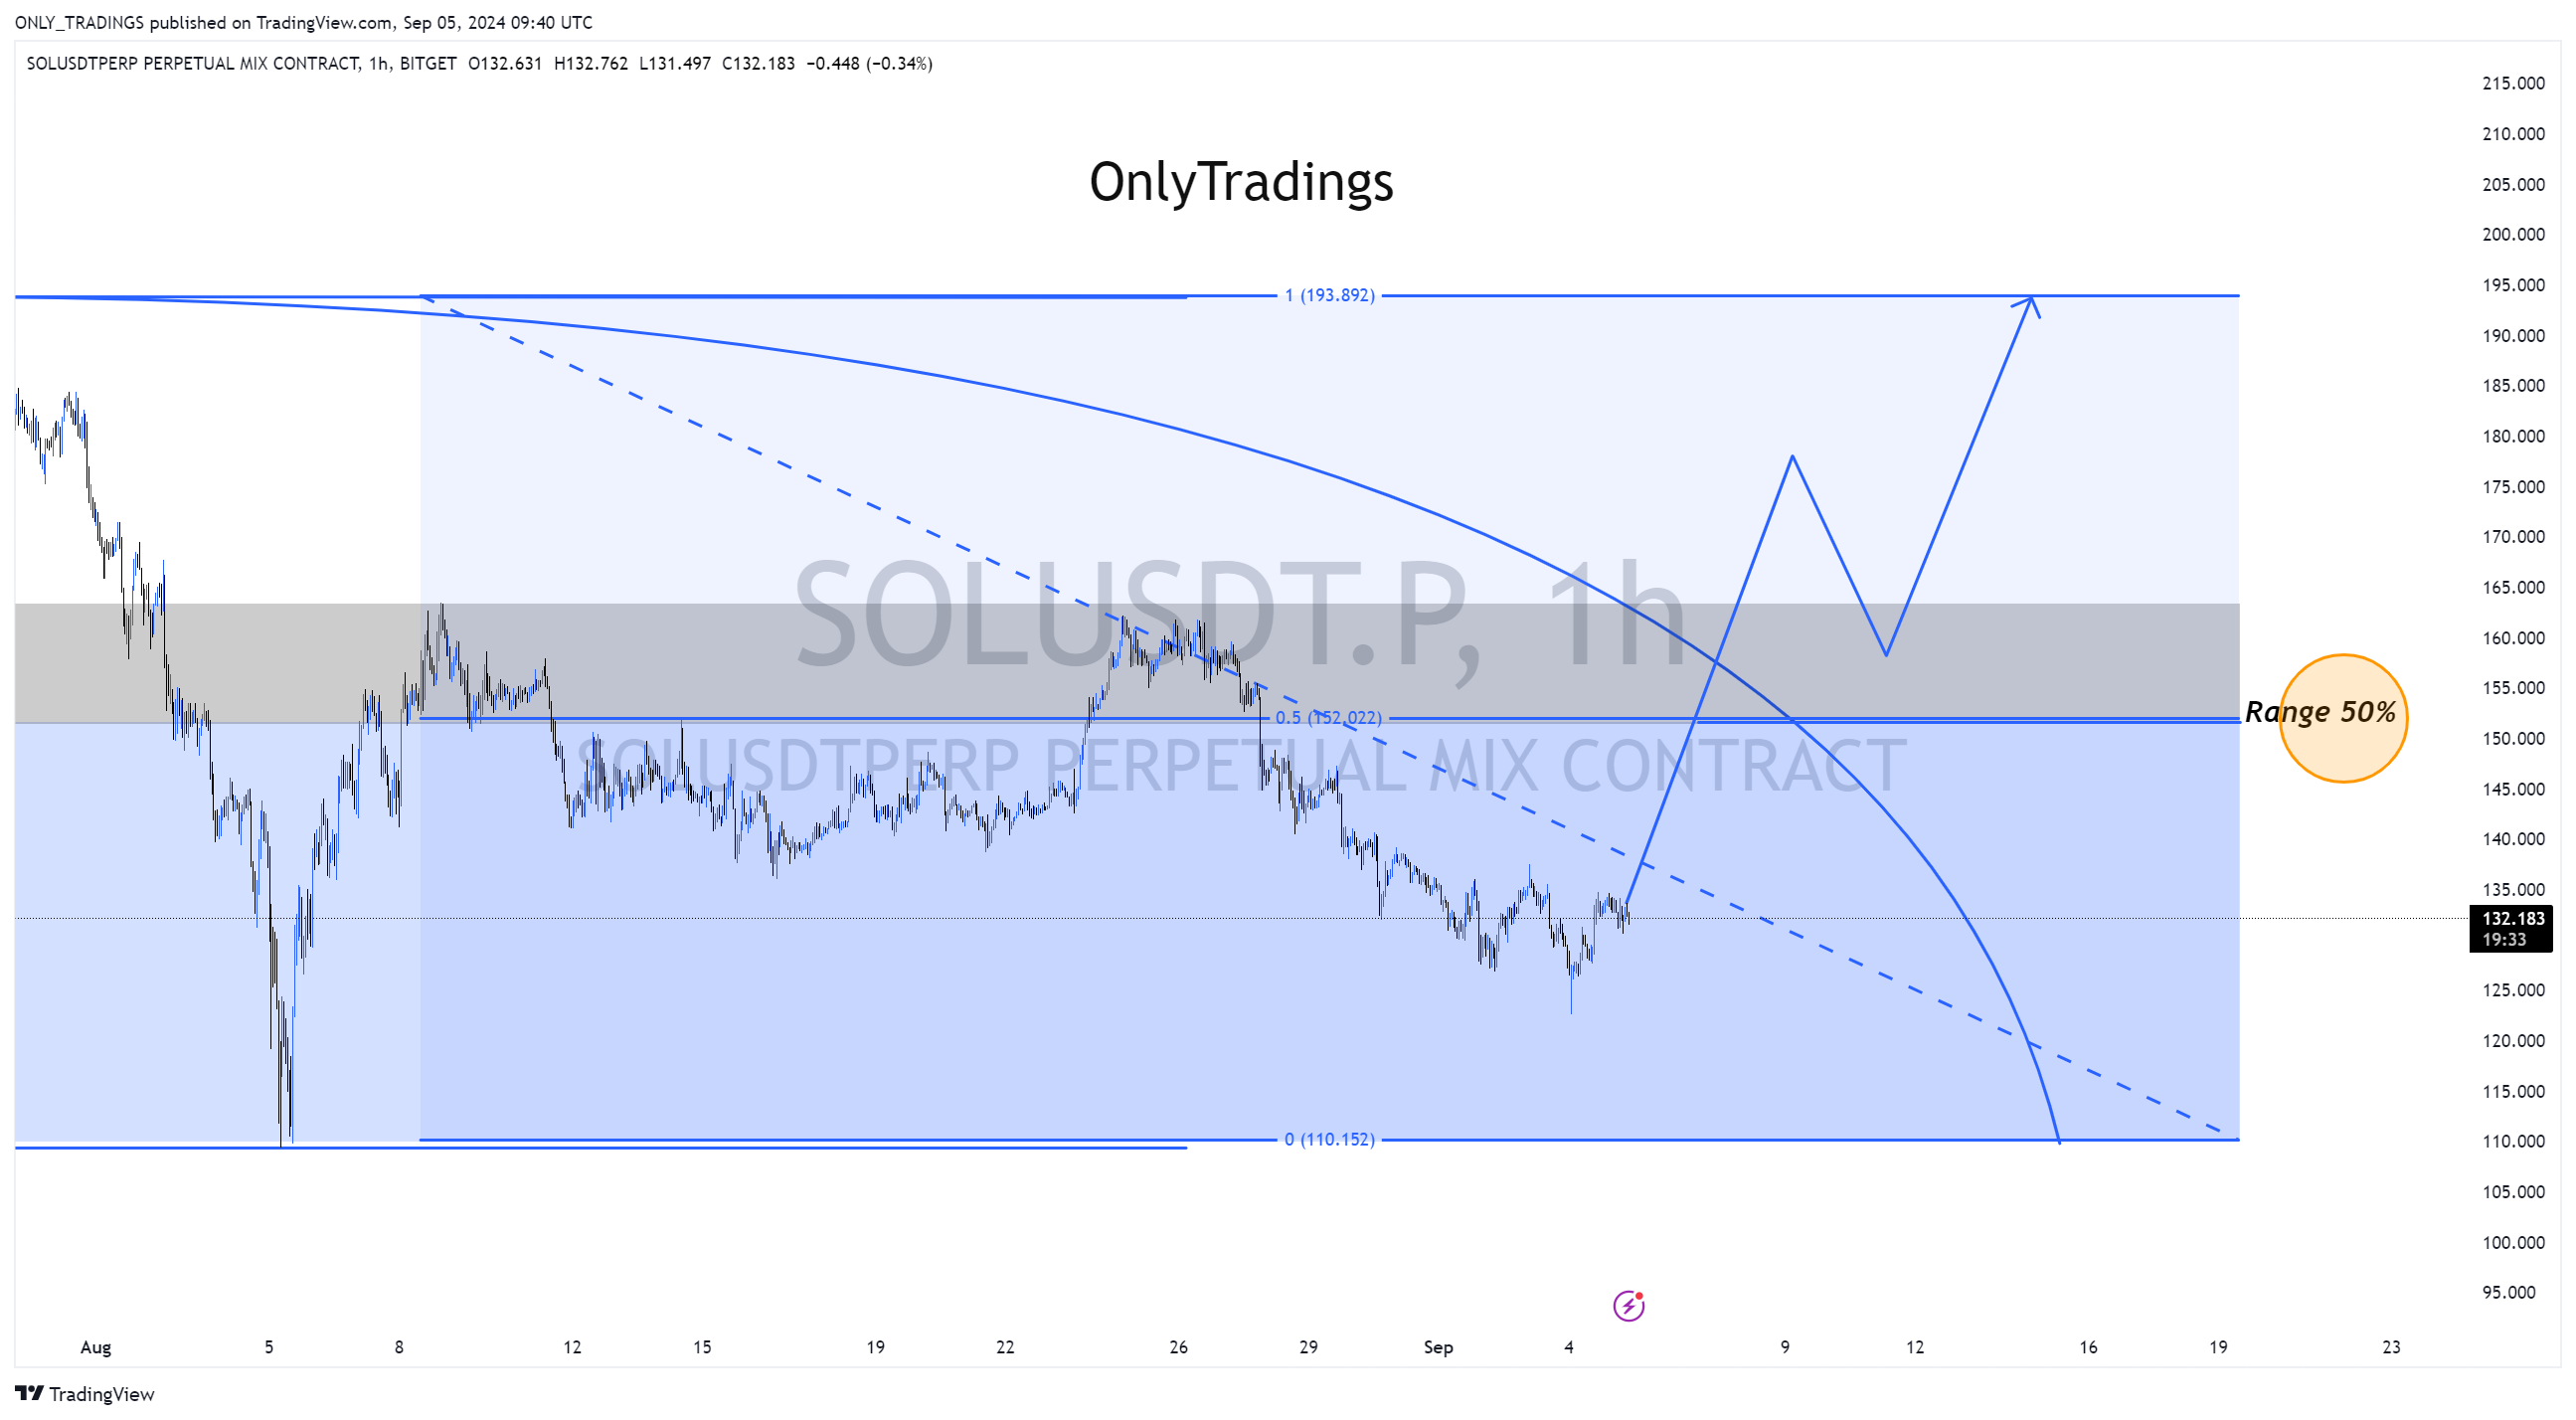
The range for Solana is as shown in the chart above. Despite the high volatility, when the market maintains this kind of broad box pattern, it becomes important to accurately identify clear ranges like this. Typically, you need to know how to set the range by connecting high points to low points and low points to high points, using inflection points as the basis for each range.

Therefore, the most important aspect of the current Solana chart is understanding where the price is located within the range.
Currently, Solana is positioned below the middle line, which is the 50% Fibonacci level. Until it crosses this middle line, it’s important to take a conservative approach by focusing on sell strategies rather than buy. Hence, I will focus on selling until Solana surpasses the 50% level. If it does break above, I will then look for a retest and shift to a buy strategy accordingly.

