ANALYSIS BY ONLYTRADINGS.COM
Instrument: BTC/USDT
Time Frame: 15M
Exchange: Bitget
Trading Type: Day-Trading

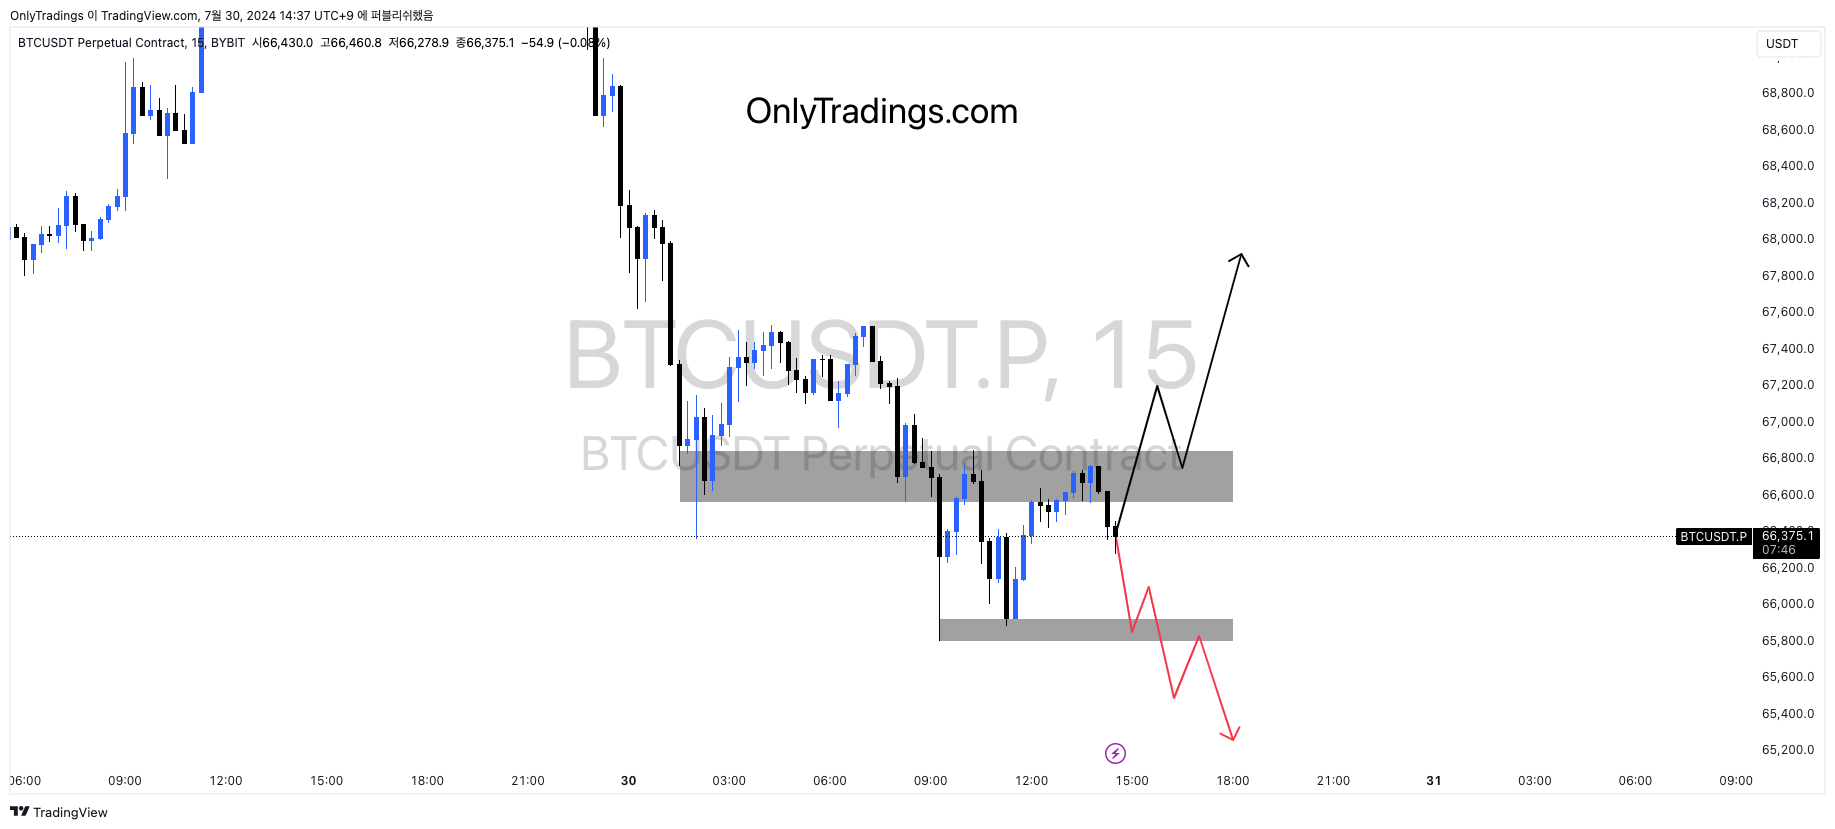
Chart Overview: The chart displays the BTC/USDT price movement on a 15-minute timeframe, highlighting potential scenarios for both bullish and bearish movements. The analysis points out key areas of interest, likely fair value gaps (FVG), and probable market behaviors.
Bullish Scenario:
- The price is currently within a consolidation zone.
- If the price breaks above the consolidation area (marked by the grey zone), it is expected to move upwards towards the next resistance level.
- The bullish movement is indicated by the black arrow. The strategy involves waiting for the price to break out and then entering a long position after confirming the breakout with a possible retest.
Bearish Scenario:
- Alternatively, if the price fails to break above the consolidation zone and instead breaks downwards, it is expected to head towards the lower support area.
- The bearish movement is indicated by the red arrow. The strategy suggests entering a short position if the price breaks below the consolidation zone and confirms the breakdown with a retest.

