
Bitcoin (BTC/USDT) 4H Technical Analysis: Bullish Breakout
or Bearish Reversal?
Overview
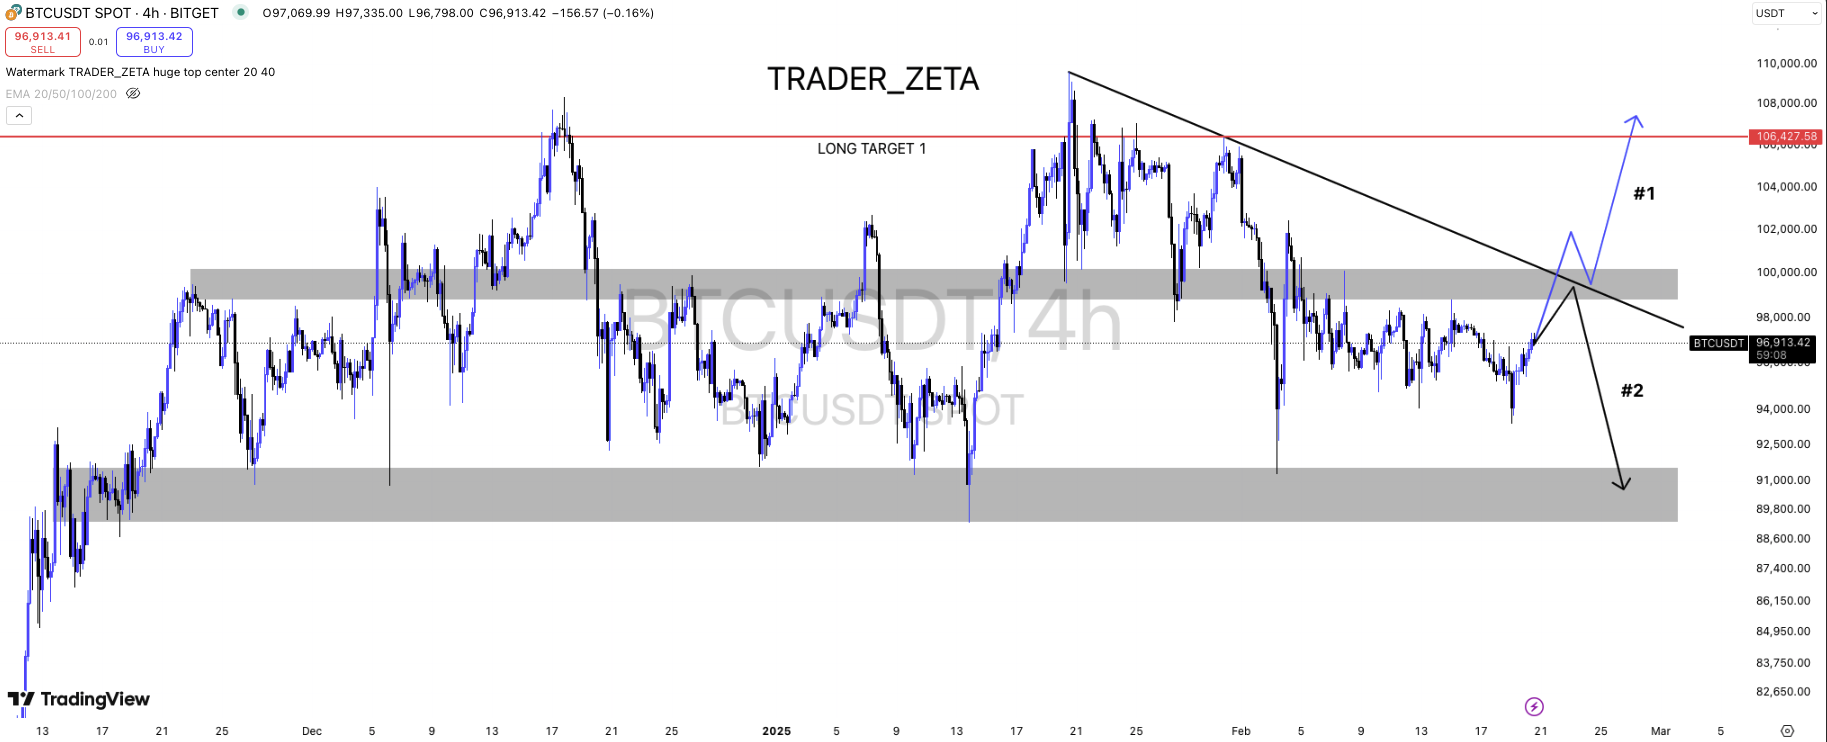
The BTC/USDT 4-hour chart presents a decisive moment, where the price is hovering near a critical trendline resistance. Two potential scenarios unfold: a bullish breakout (#1) leading to a rally toward the $106,000 region or a bearish rejection (#2) pushing the price lower toward the $90,000 zone.
Key Technical Levels
- Current Price: ~$96,934 (as per chart)
- Resistance Zone: ~$98,000 - $100,000
- Major Support: ~$90,000
- Long-Term Resistance (Target 1): ~$106,427
Scenario 1: Bullish Breakout (#1)
A breakout above the descending trendline would signal renewed bullish momentum. If BTC can sustain above $98,000 and reclaim the key resistance zone near $100,000, it could trigger a rally toward the $106,000 mark.
Bullish Indicators:
#1. Higher Low Formation: Despite the recent downtrend, the price has formed higher lows, suggesting accumulation.
#2. Breakout Potential: The price is pressing against a descending resistance trendline. A breakout above could lead to a sharp move upward.
#3. Liquidity Above Resistance: Many stop orders may be resting above $98,000-$100,000, triggering further buying pressure once that level is breached.
#4. Validation of this scenario:
- A 4H candle close above $98,000 with strong volume would confirm the breakout. A successful retest of the trendline as support would reinforce the uptrend continuation.
Scenario 2: Bearish Rejection (#2)
If BTC fails to break the trendline resistance and faces rejection at $98,000, a move downward toward the $90,000 region becomes more likely.
Bearish Indicators:
#1. Descending Trendline Pressure: BTC has been respecting the downtrend resistance, and another rejection could continue the lower high structure.
#2. Failure to Sustain Above Key Level: If bulls fail to reclaim the resistance zone, it may indicate a lack of strength.
#3. Support at $90,000: A drop to the lower demand zone could be an area where buyers step in for accumulation.
#4. Validation of this scenario:
- A strong rejection from the trendline with high selling volume would confirm weakness. A break below $94,000 would further strengthen the bearish case, leading to a potential retest of the $90,000 demand zone.
Conclusion: Which Scenario is More Likely?
Currently, BTC is at a make-or-break point near the trendline resistance. The next few 4H candles will determine whether a bullish breakout or bearish rejection occurs.
Bullish Bias: If BTC breaks above $98,000 with strong momentum, the price will likely rally toward $106,000.
Bearish Bias: If BTC fails to break and gets rejected, a correction toward $90,000 becomes probable.
Traders should watch for confirmation signals before making a move, as the market is at a critical juncture. Volume and candlestick structure will provide crucial insights into the next major price direction.