Analysis By Onlytradings.com
Instrument: BTCUSDT
Time Frame: 1 DayExchange: Bitget
Trading Type: Swing Trading
Recent Issues
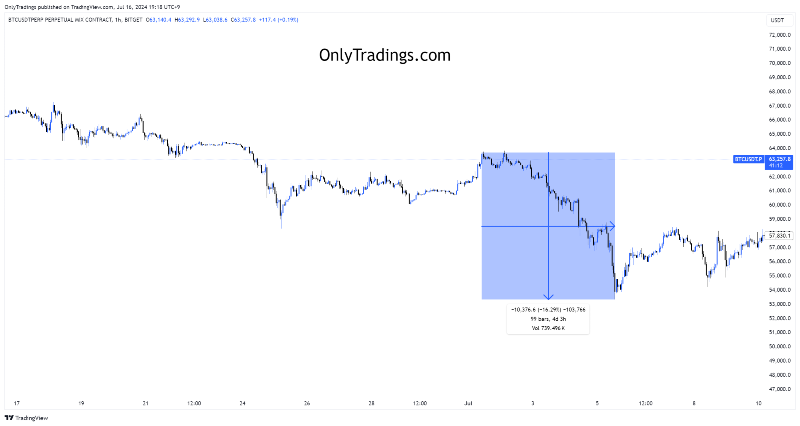
Bitcoin has recently experienced a drop of over 16% in just 4 days (based on 63.8k).
This decline has resulted in liquidation amounts exceeding $30 million in BTC alone.

Technical Analysis Using Trend Lines
There are various methods to conduct technical analysis. Today, we will use trend lines to gauge market sentiment.

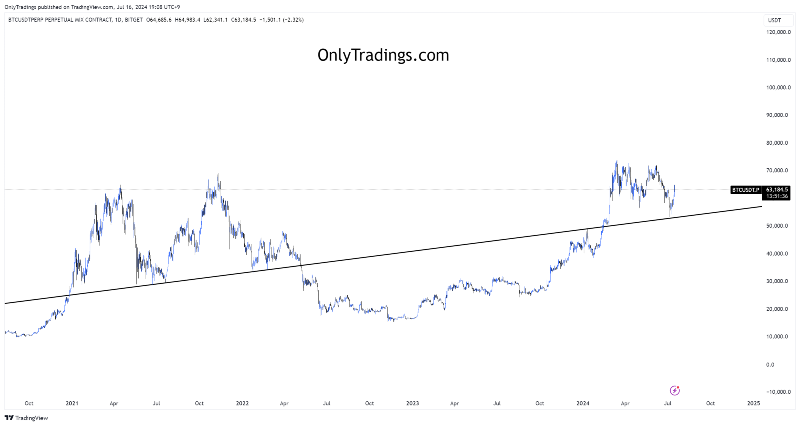
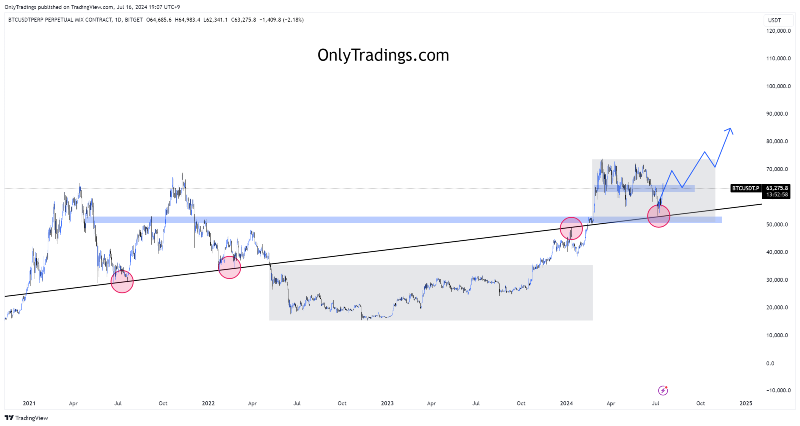
Currently, Bitcoin is at a critical juncture where it could either continue its upward trend or shift towards a downward trend. This trend line has been a crucial benchmark from 2019 through 2020, 2021, 2022, 2023, and remains relevant in 2024.

After examining the breakouts that occurred immediately after the red points and the second point, you will see how crucial this benchmark trend line is.
Currently, we can observe that this trend line is providing support. It's important to note that the future direction of Bitcoin will depend on whether it can maintain this support when it touches the trend line again. If it can continue to provide support, Bitcoin is likely to follow an upward trend. If not, a downward trend may ensue.
Key Point
Having a standard to identify long-term trends is extremely important. This trend line allows you to respond to and adjust your original trading plan, and even if your analysis turns out to be incorrect, it will facilitate new analyses.
© 2024 onlytradings.com. All rights reserved. The information in this publication is for general informational purposes only and does not constitute professional advice. onlytradings.com assumes no responsibility for errors, omissions, or outcomes related to the use of this information. We maintain a neutral stance on all political matters, providing unbiased content that should not be interpreted as an endorsement of any political party, candidate, or policy. No part of this publication may be reproduced or transmitted without prior written permission. For inquiries, visit www.onlytradings.com.

