Instrument: BTCUSDT
Time Frame: 1 hour
Exchange: Bitget
Trading Type: Swing Trading

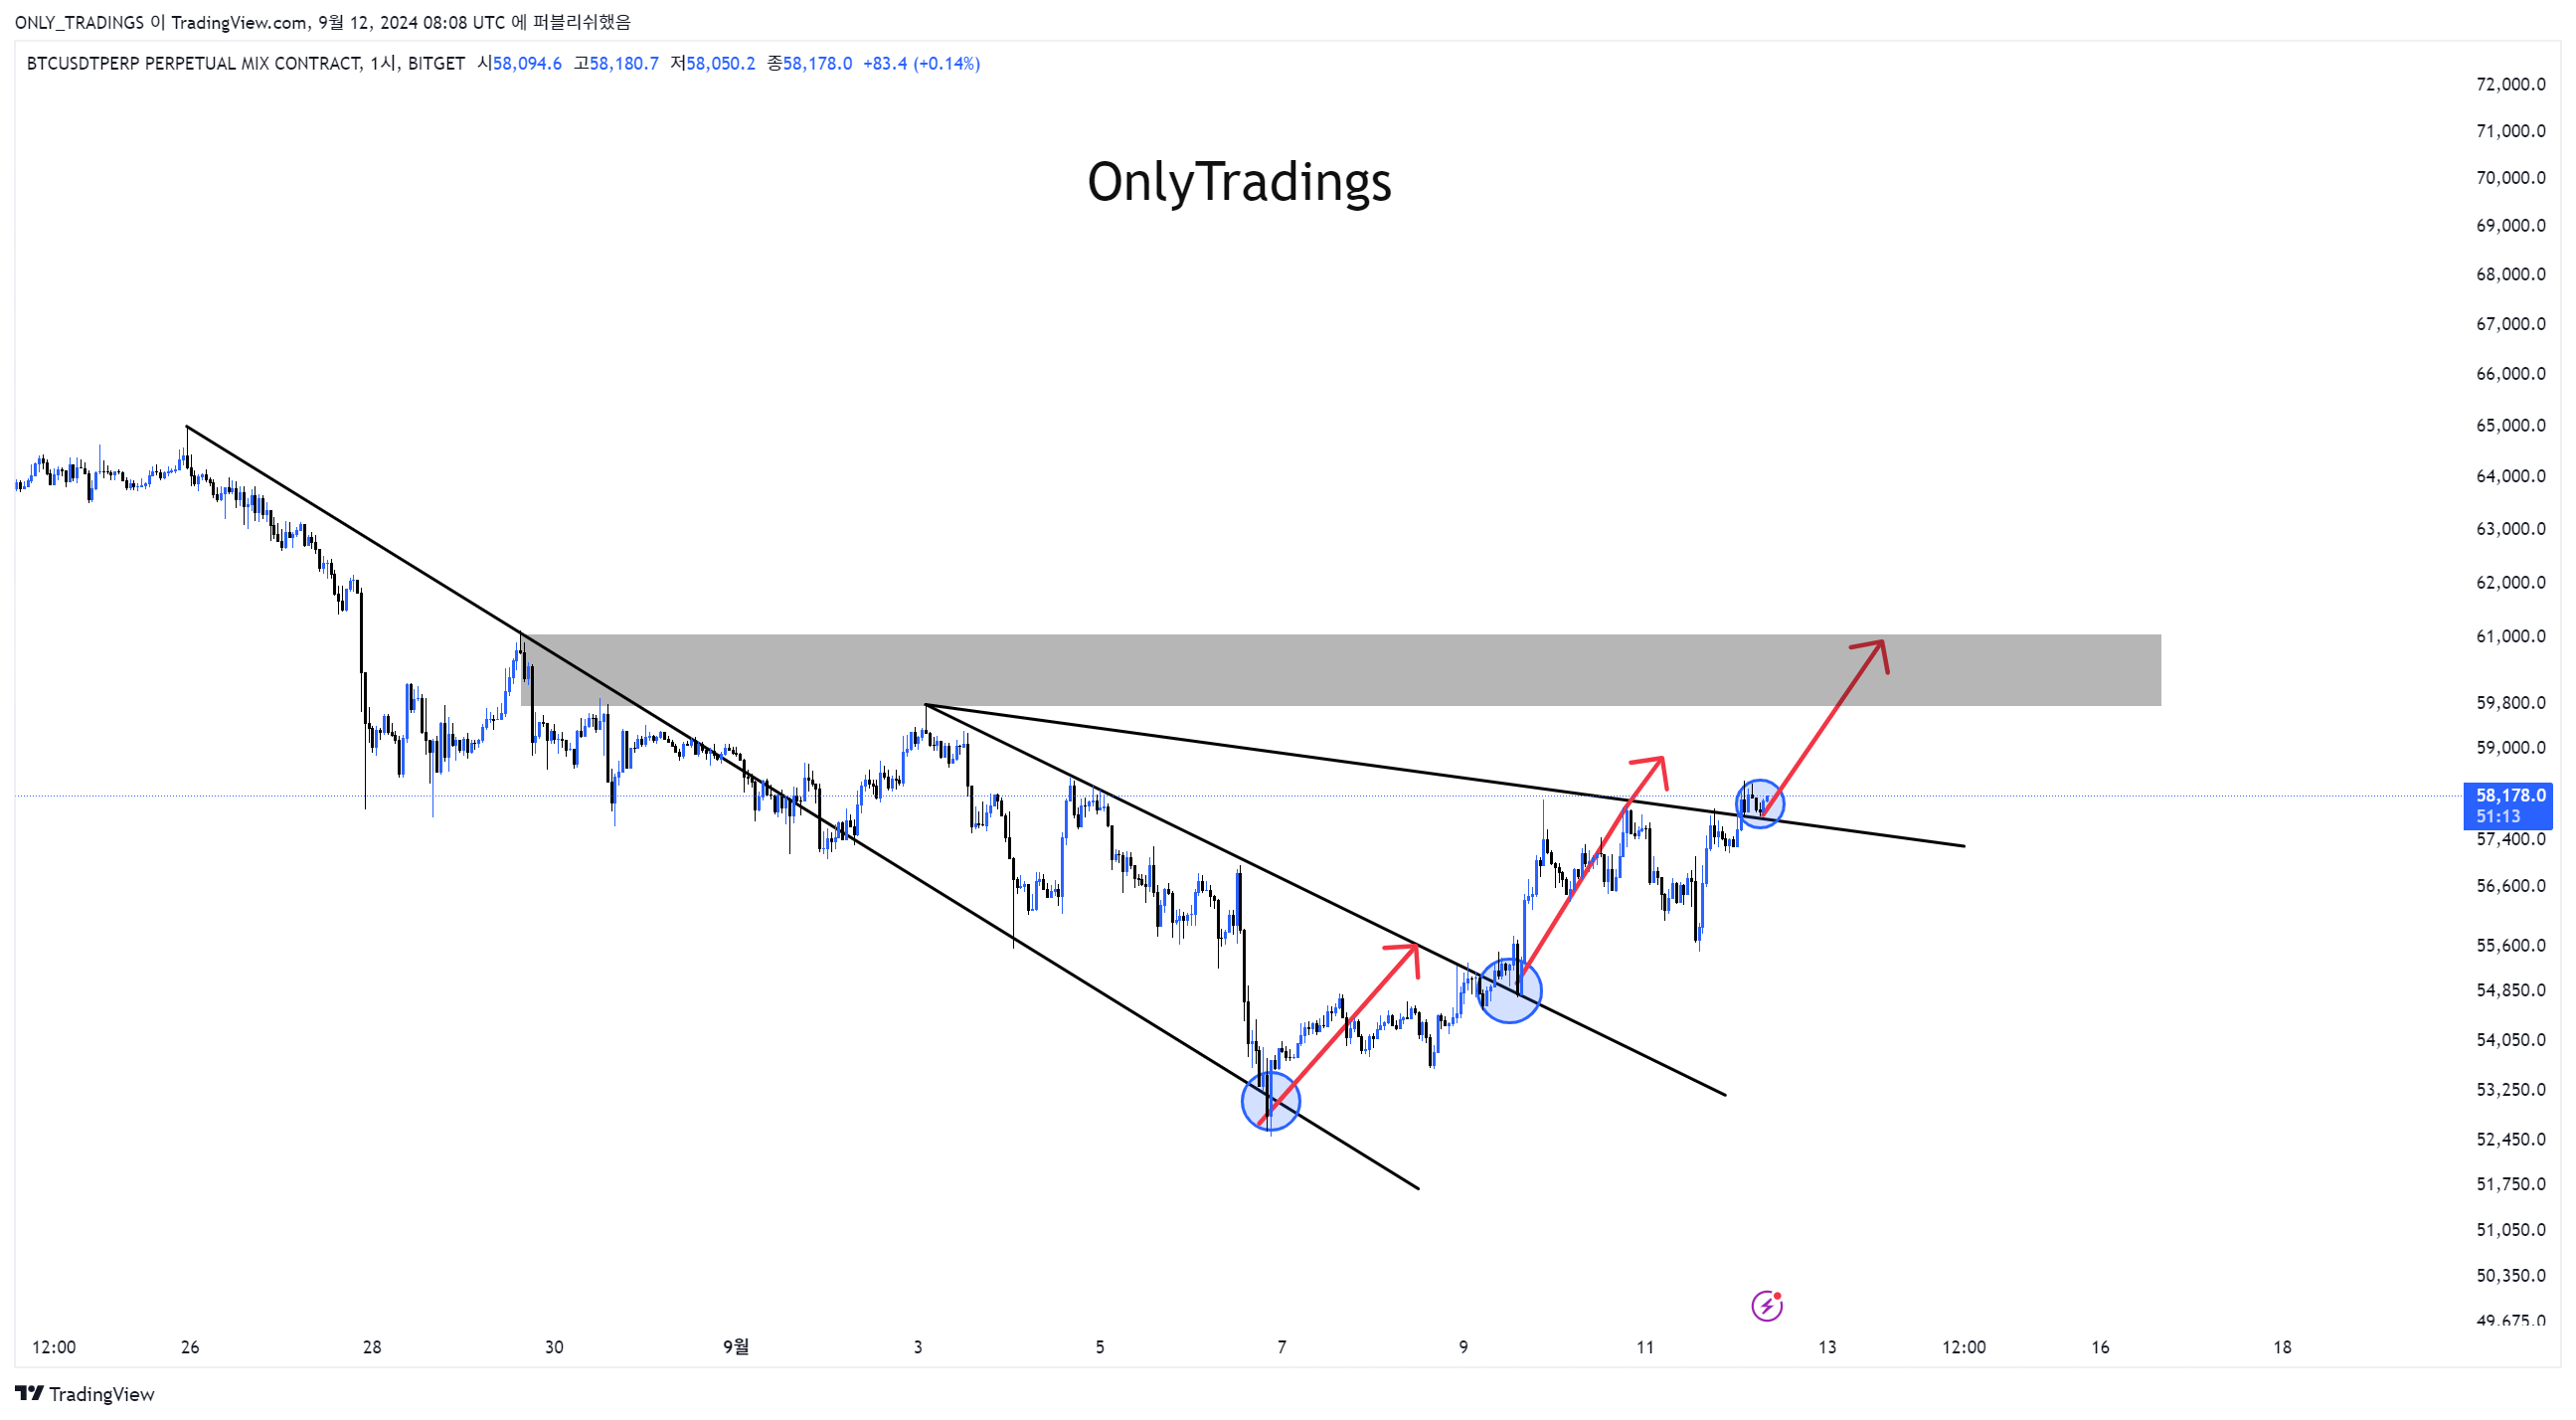
Looking at the pattern since the recent high (65k) up to now, it may appear that this behavior is specific to BTCUSDT, but whenever it breaks through the most recent downtrend, we can consistently see a retest of the trendline before a significant rally occurs. Recently, this has happened about twice, as can be seen in the blue circled areas where the details are clearly visible.
Additionally, after an upward movement from that zone, resistance tends to occur near key levels around the inflection points of the previous correction zone. Based on this, the following setup can be planned.
Summary:
1. After clearly surpassing the current lower time frame high of 58.5k and showing continued strength above, a long position can be entered.
2. If the retest of the trendline fails, a sweep in the higher time frame (HTF) can be considered.
3. If a long position is entered according to strategy 1, the target zone can be set between the key levels of 59k to 61k, which corresponds to the previous inflection point.

