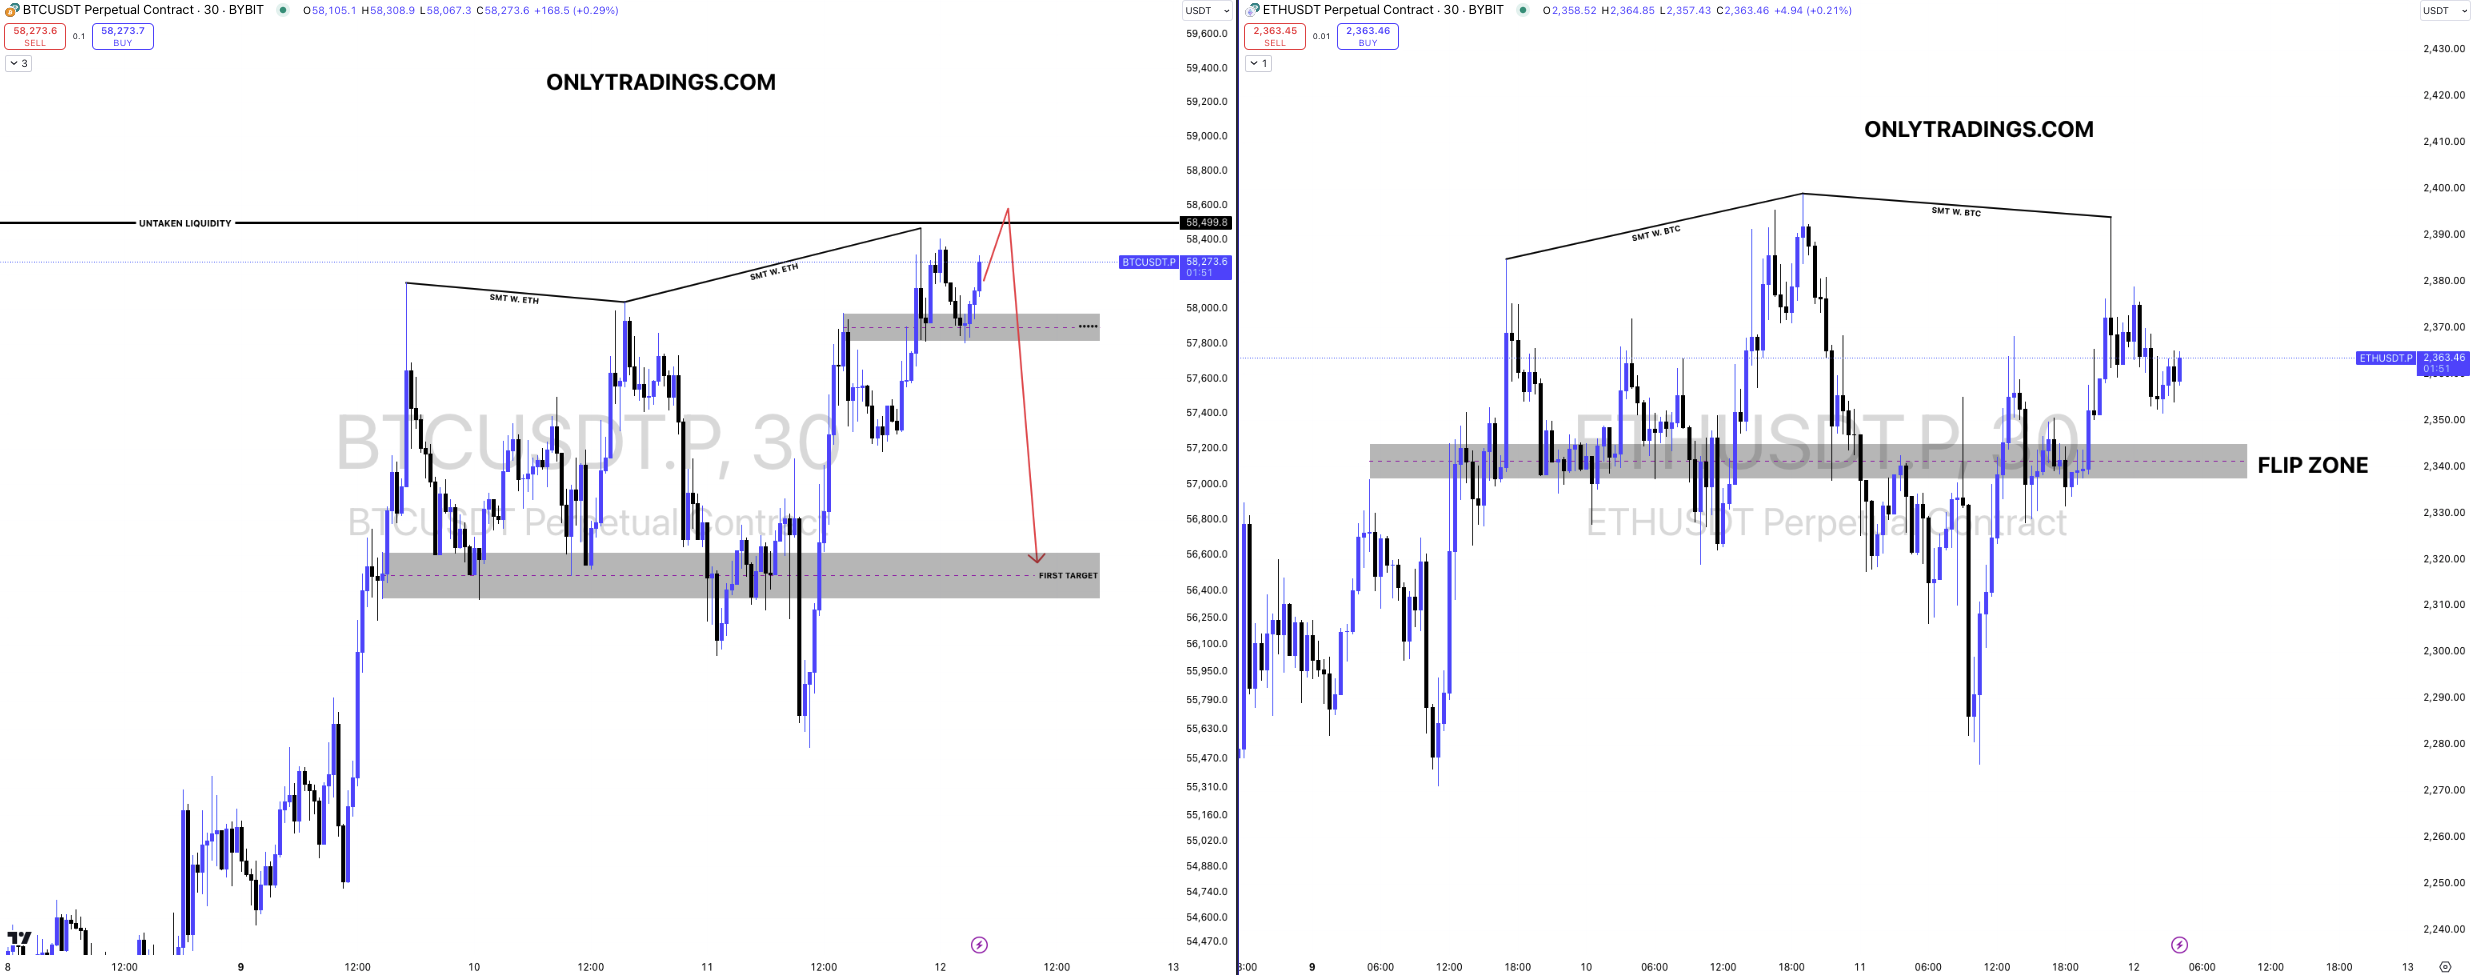
BTC/USDT 30-Minute Chart:
Liquidity Target and Potential Drop Amid SMT Divergence
Instrument: BTCUSDT
Time Frame: 30M
Exchange: Bybit*
Trading Type: Swing Trading
*We apologize for extracting the chart from Bybit Exchange.

BTC/USDT 30M Chart Update:
Today’s setup is critical as I believe there is a high possibility of a significant drop in Bitcoin's price. The left chart represents the BTC/USDT market, and the right chart shows the ETH/USDT market. Both charts exhibit a phenomenon known as SMT (Smart Money Technique) divergence. This signal is commonly observed before sharp price movements, particularly when occurring near key levels, which raises its reliability.
The region marked as "Untaken Liquidity" has been previously discussed and posted on our platform, OnlyTradings.com, as well as on our social media channels.
Summary of Market Movements:
Untaken Liquidity Zone (posted on September 5):
This zone was highlighted in my prior posts, anticipating a touch on this level. On September 10, the price touched the midpoint of this level and quickly surged upward.
Current Situation (as of September 12):
The price is now approaching another significant Untaken Liquidity area around the $58,800 mark. My scenario suggests that once this liquidity level is touched, it will likely create another SMT divergence, leading to a sharp drop in the market.

