Instrument: BTCUSDT
Time Frame: 15m
Exchange: Bitget
Trading Type: Swing Trading

Here is a brief overview of a short setup for BTCUSDT on the 15-minute time frame:
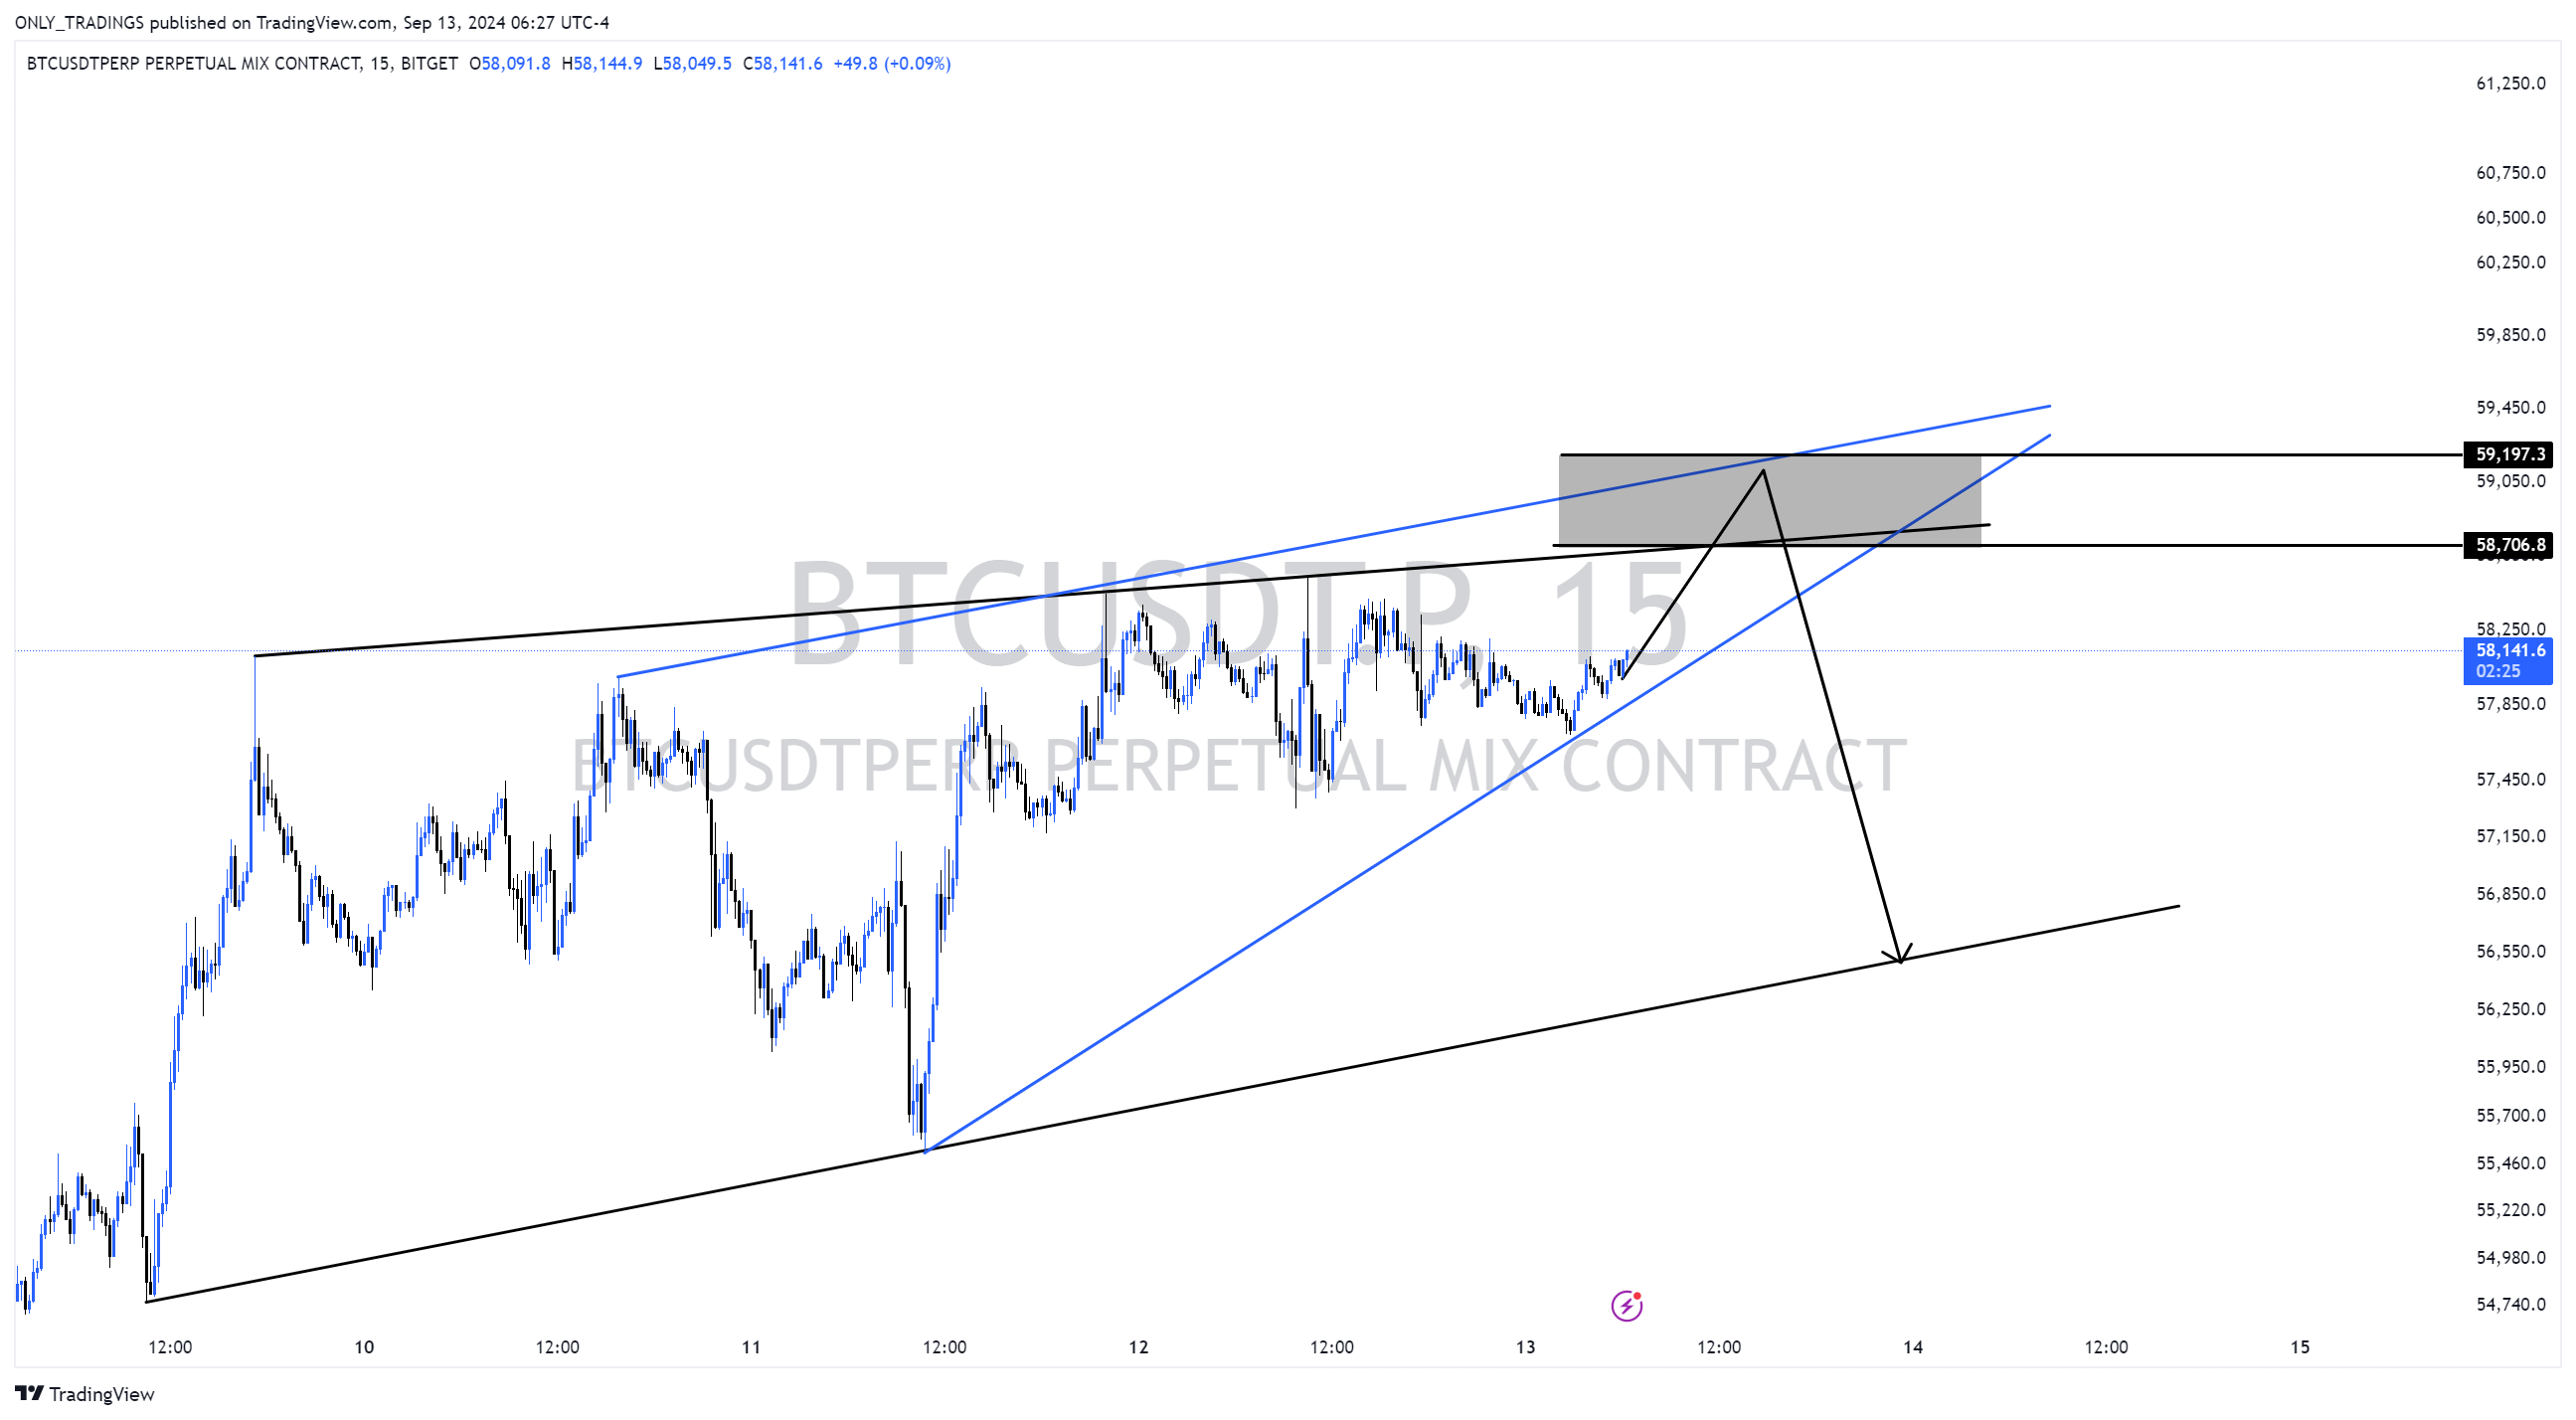
Currently, Bitcoin is forming roughly two types of wedge patterns.
The black trendline represents Pattern 1, and the blue one represents Pattern 2.
If you primarily focus on Pattern 1, you might expect a reaction around the upper 58k range. However, using this approach alone increases the risk of being caught in a stop hunt.
If only Pattern 1 were identified, I would combine other factors (like Wyckoff, ICT, etc.) for analysis. However, since both wedge patterns are overlapping in this zone, you can anticipate the stop hunt area of the lower wedge (Pattern 1) using the higher wedge (Pattern 2). This creates a setup where you can rely on the wedge pattern alone to form your strategy.

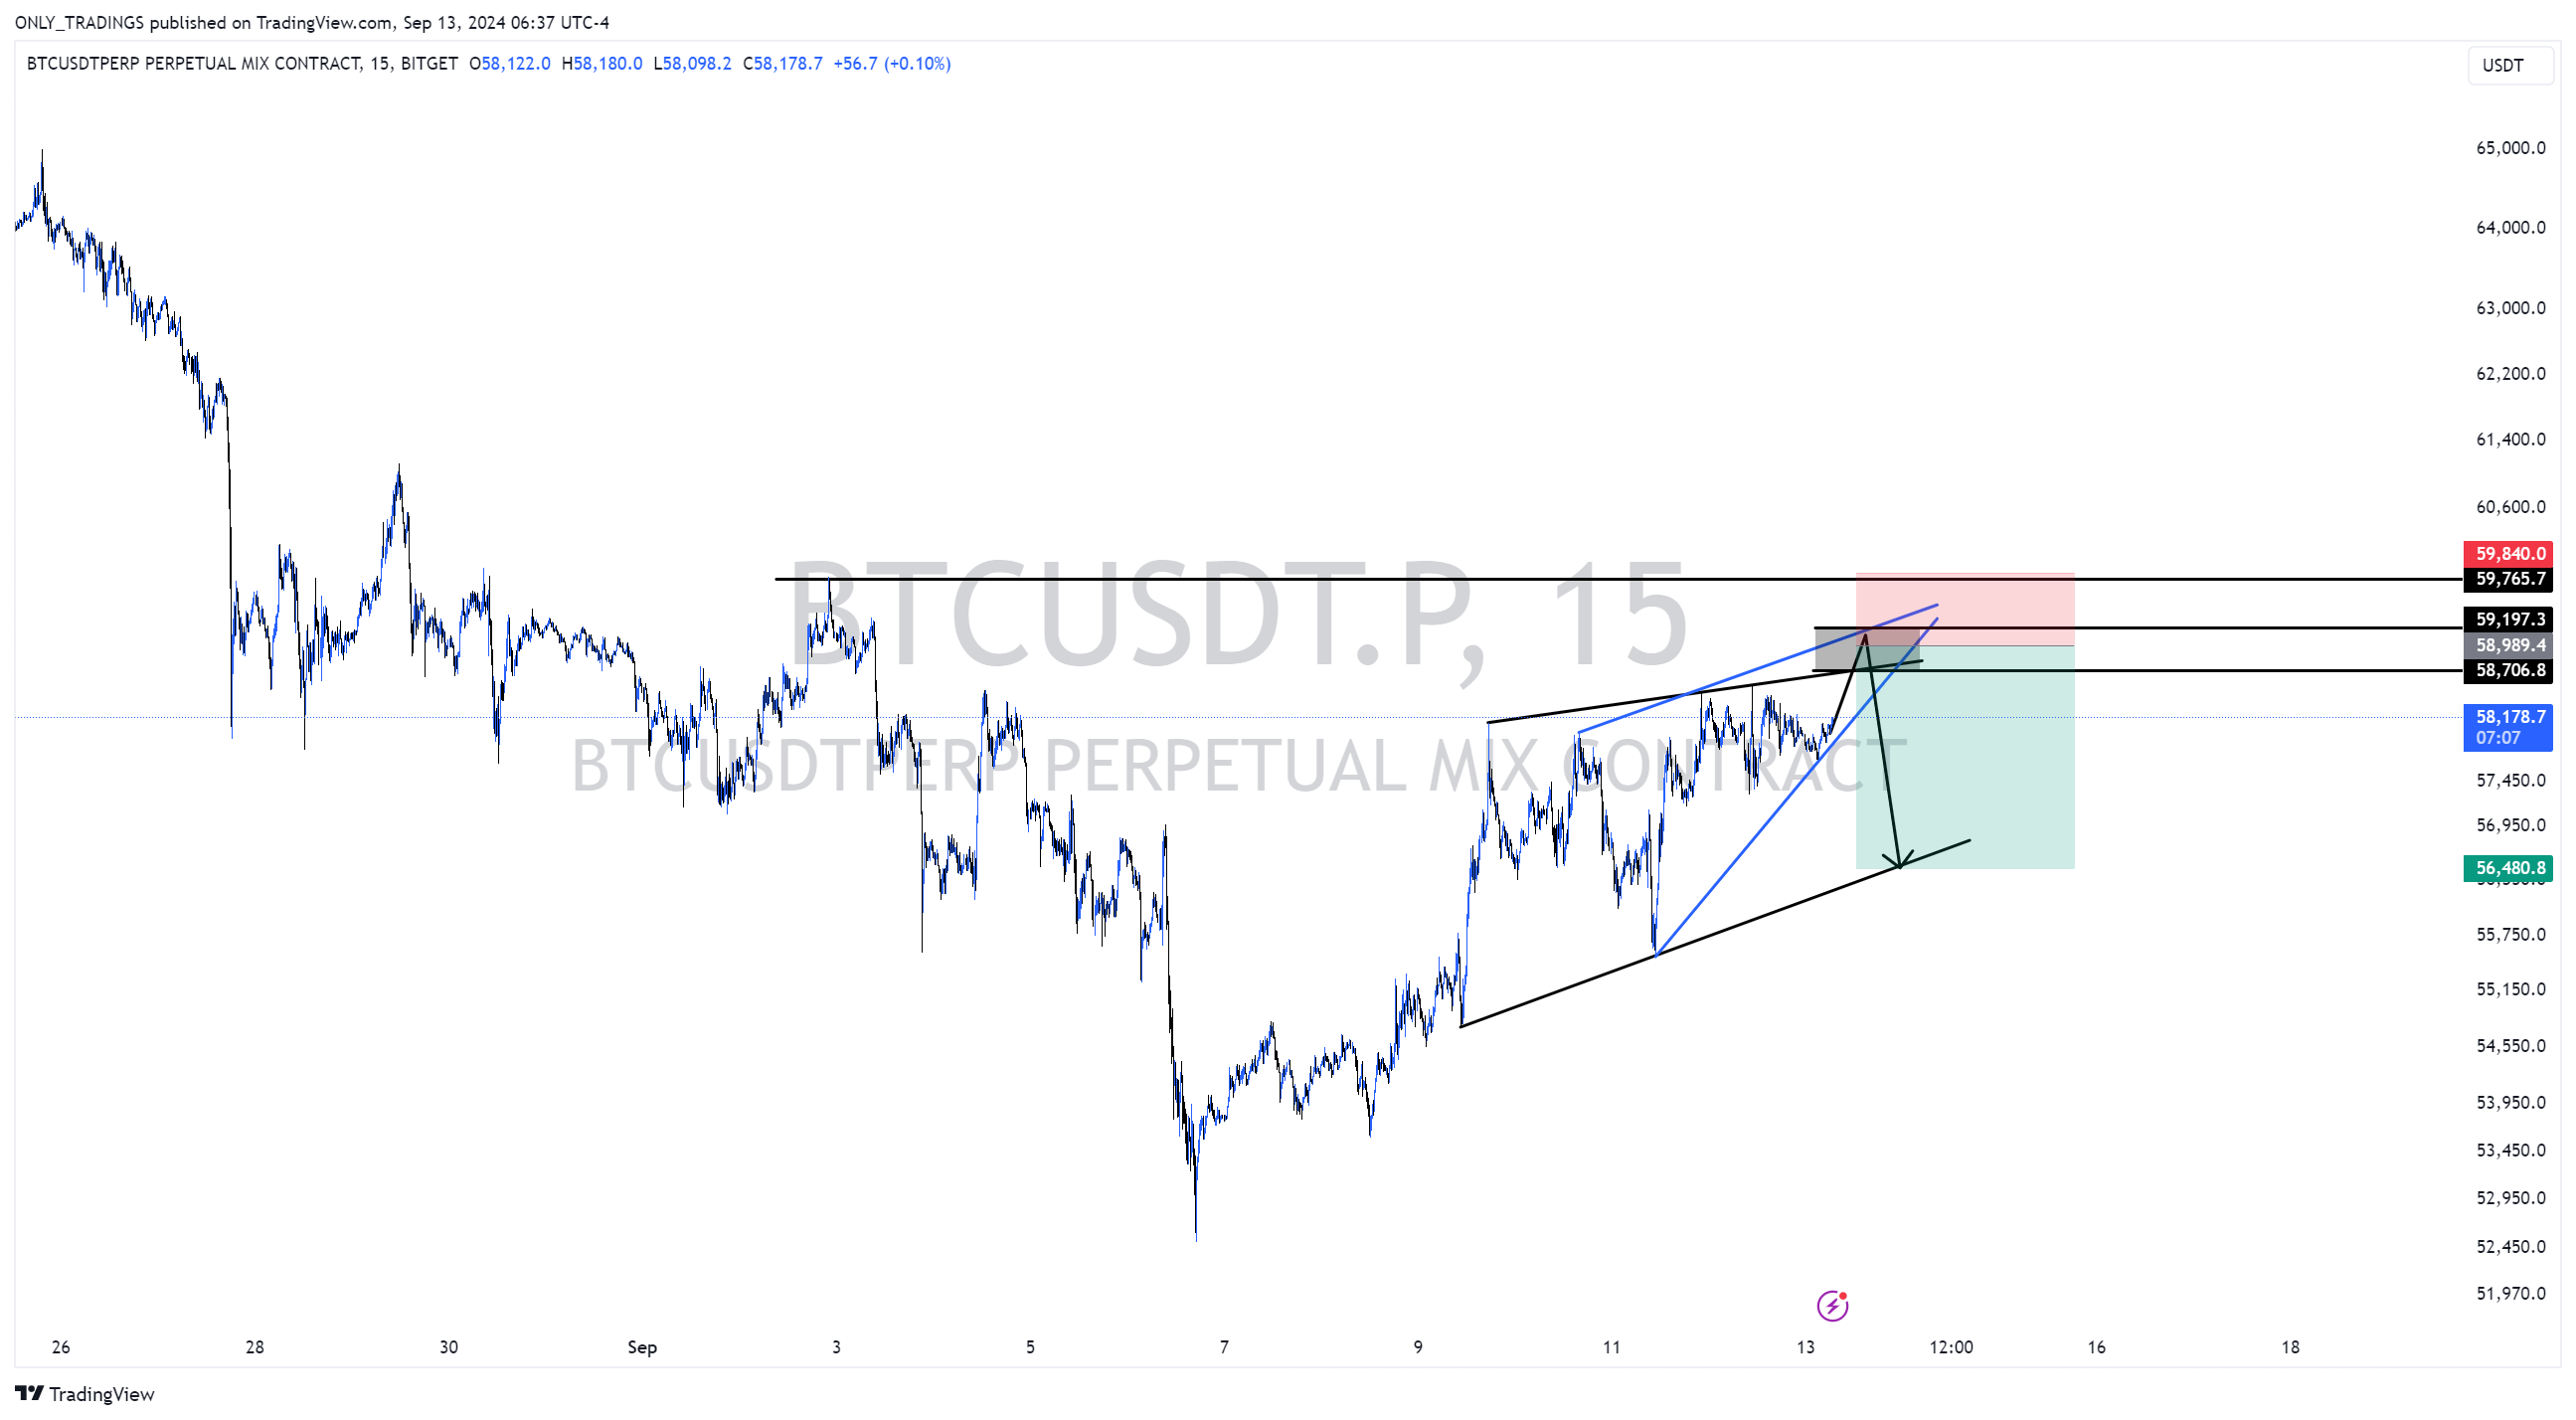
If we express the overlapping zone in terms of price, it would be as follows:
1. Overlapping zone: $58,700 - $59,200
2. Stop zone: $59,800
3. Target zone: $56,500
Risk-to-reward ratio: approximately 3:1

