Instrument: BTCUSDT
Time Frame: 30m
Exchange: Bitget
Trading Type: Swing Trading

Here’s a trading setup for Bitcoin on the 30-minute chart:
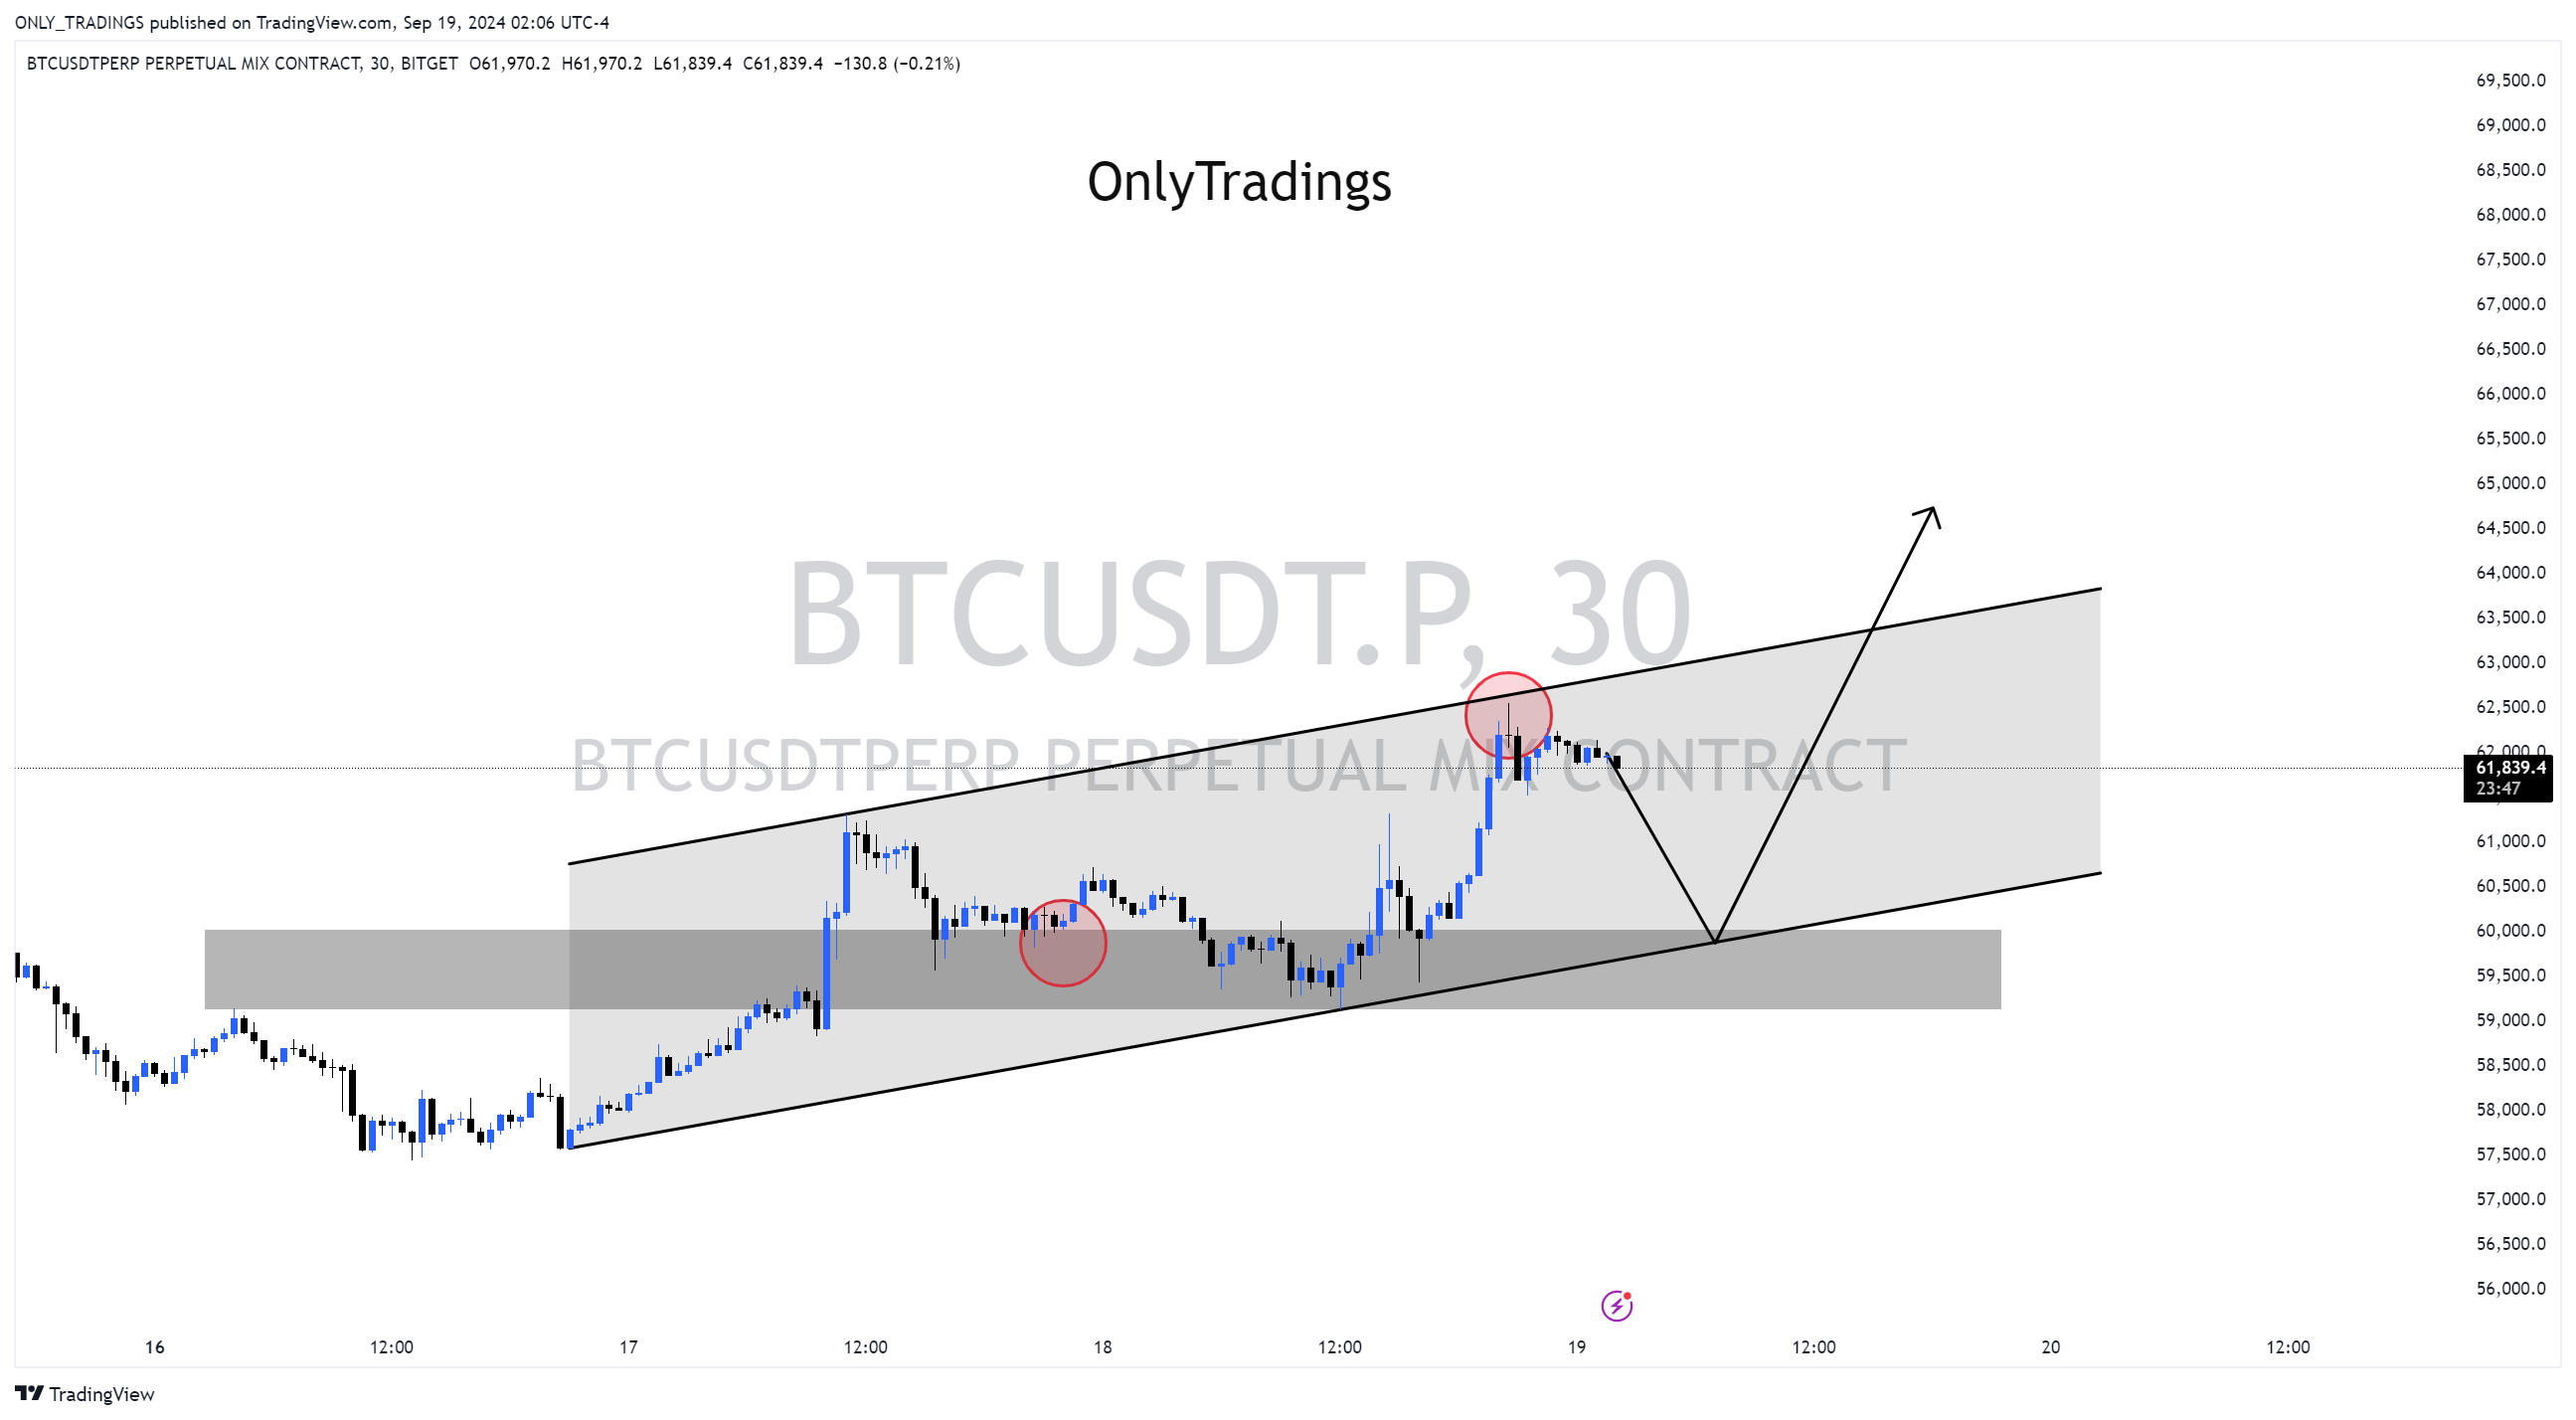
Currently, Bitcoin is facing resistance at the upper boundary of a short-term horizontal channel. Prior to touching the top of the channel, it received support at the lower Demand Zone. Using this fractal as a reference, if Bitcoin comes down again, I plan to consider a similar Demand Zone as the main support area and open a buy-oriented position based on that.

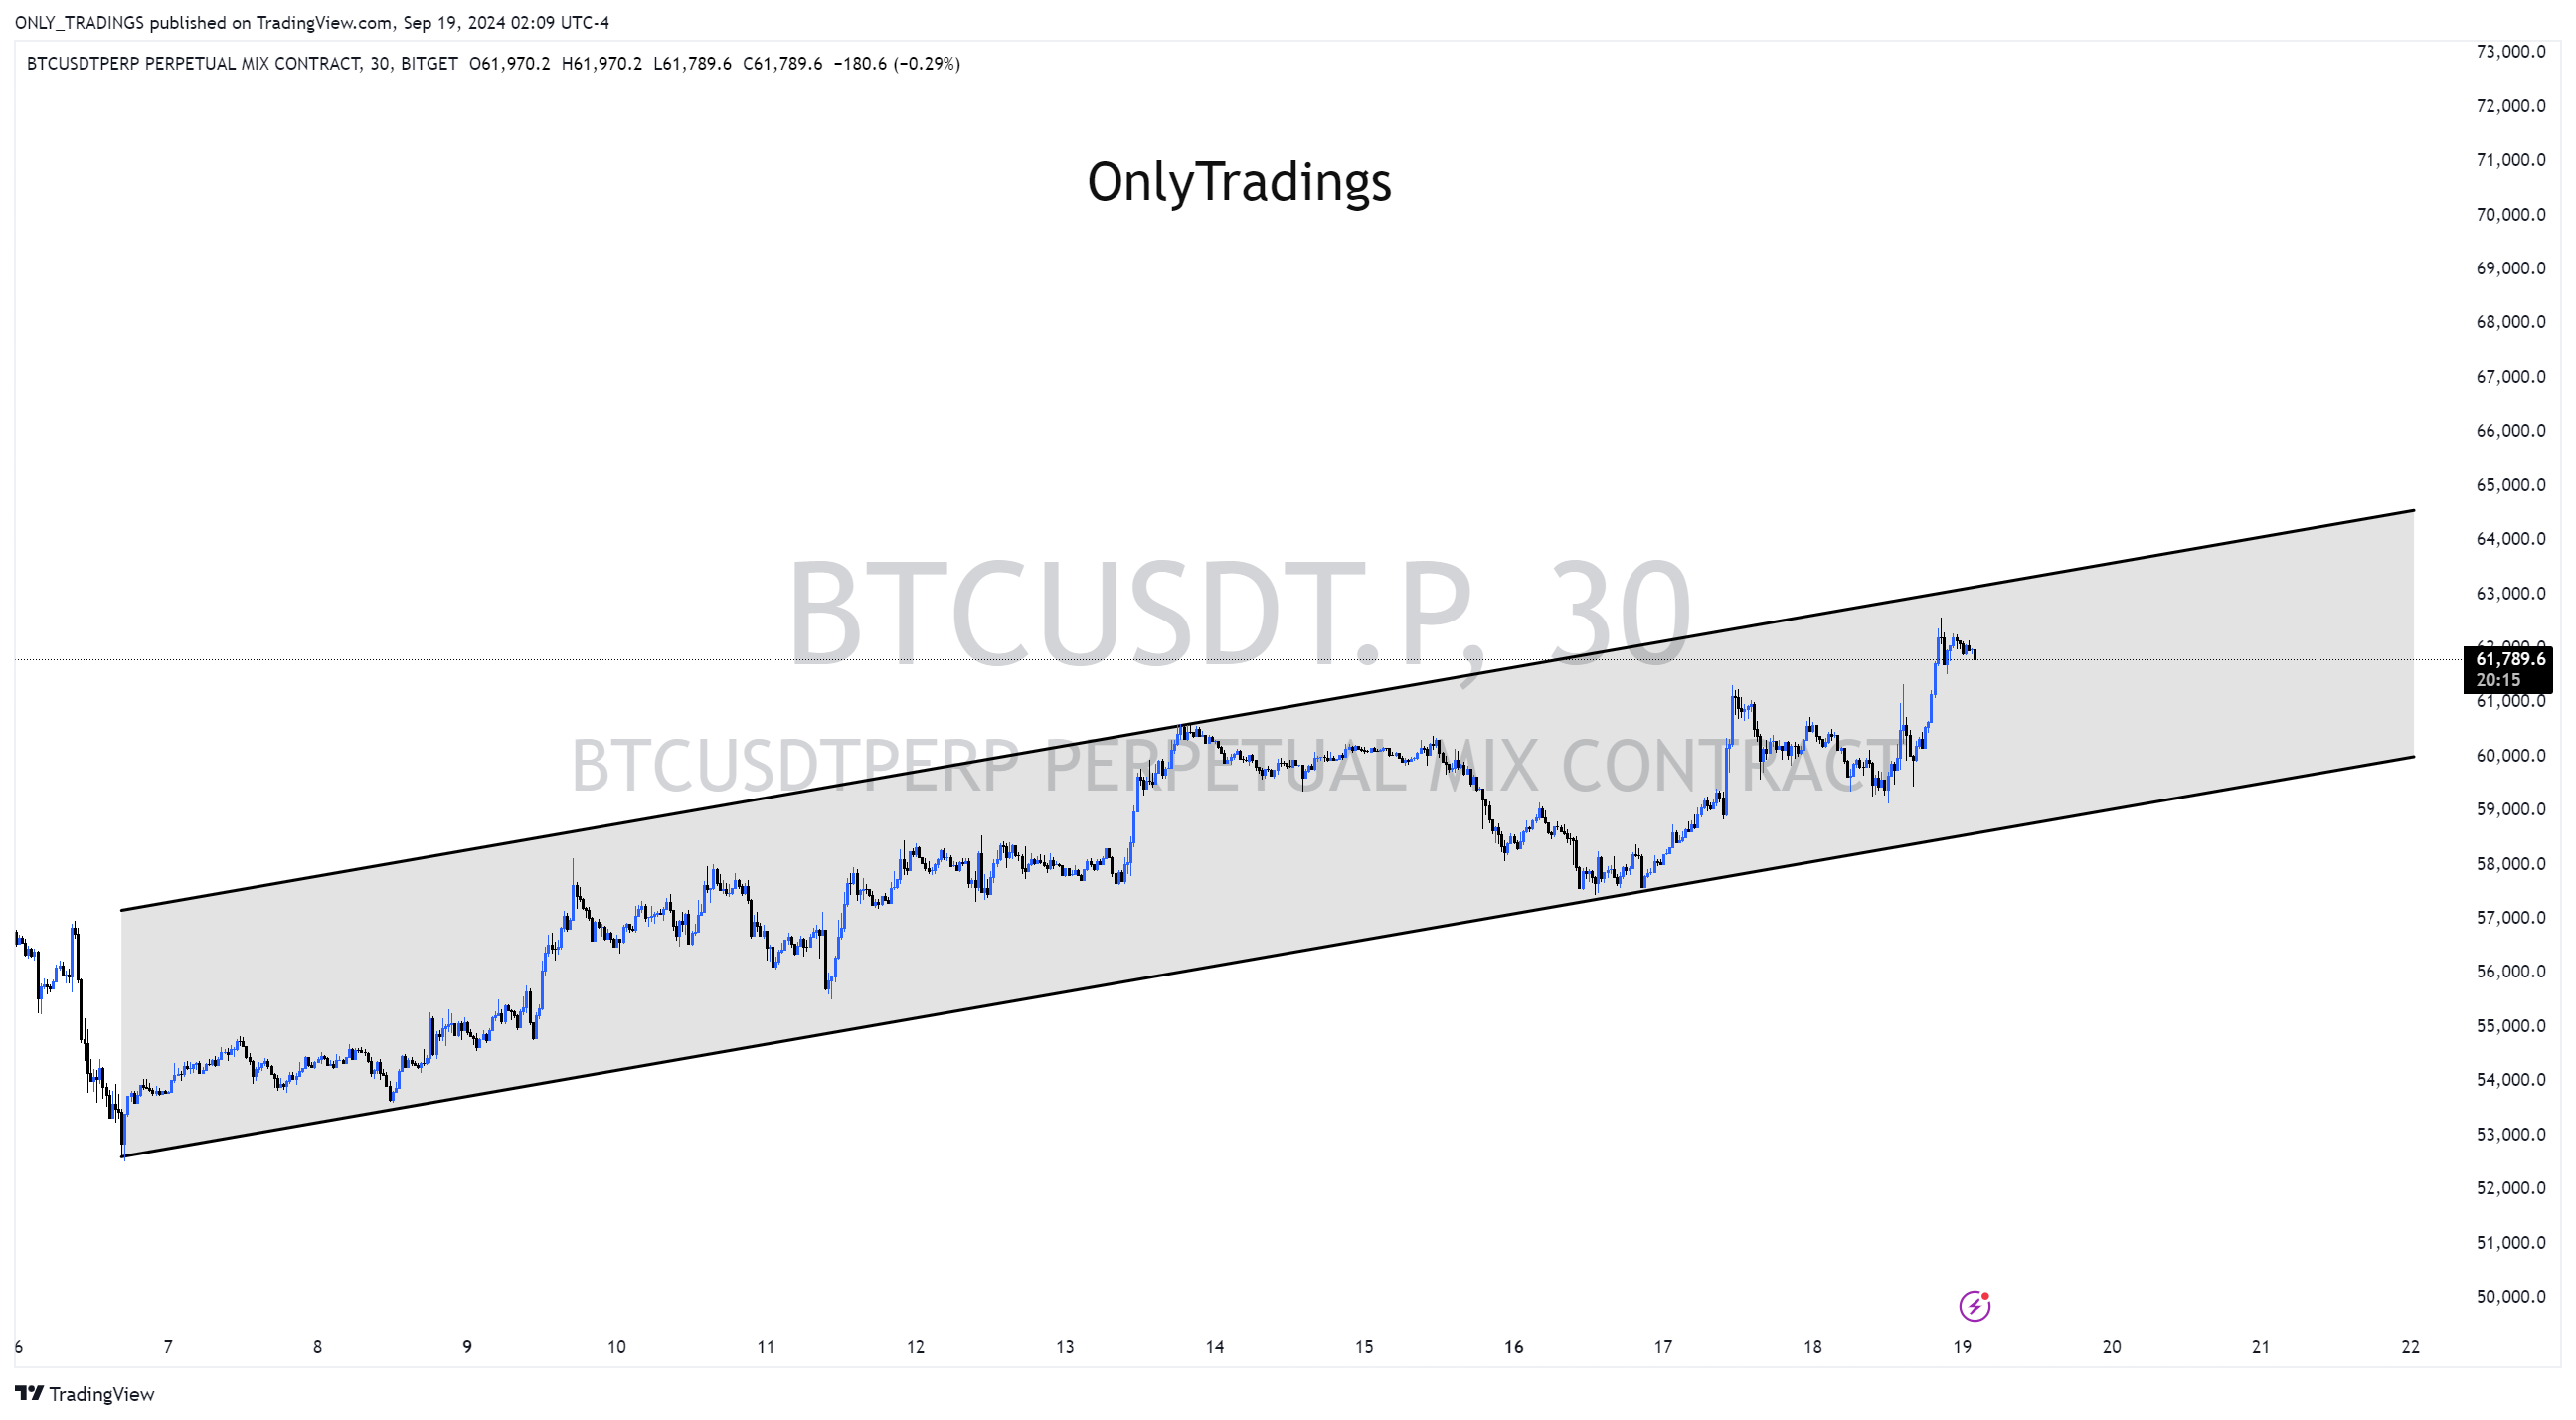
The larger channel is structured as follows:
If this channel breaks in either direction (up or down) in a complete break rather than a sweep, there will likely be a significant movement in the direction of the break.

